
View
- Bitcoin’s weekly MACD has diverged in favor of the bulls. The indicator carved out a higher low in December, even though bitcoin’s price slipped to $3,100, signaling waning bearish pressures 17 months before the mining reward halving. Bitcoin witnessed a similar MACD divergence 17 months before the previous halving in September 2016.
- The bullish MACD divergence indicates the cryptocurrency could be nearing a long-term bottom or may have carved out one near $3,100 in December. That said, a move above the 21-month exponential moving average (EMA), currently at $5,334, is needed to confirm a long-term bullish reversal.
- Bitcoin could rise above $4,000 if the inverse head-and-shoulders neckline, currently at $3,735, is breached. A downside break of the wedge pattern seen in the 4-hour chart could yield a re-test of $3,400.
A long-term price indicator validates a growing consensus among investors that bitcoin (BTC) is close to bottoming out.
BTC fell below $6,000 on Nov. 14, dashing hopes of a long-term bullish reversal from that long-held psychological support.
The subsequent sell-off came to a halt near $3,100 in December – 18 months ahead of the mining reward halving – triggering speculation that the cryptocurrency could bottom out in 2019. It is worth noting that BTC created a long-term bottom in January 2015 before undergoing a reward halving in September 2016.
While investors are betting that history will repeat itself, bitcoin’s corrective rally from December lows is struggling to pick up the pace.
That, however, could change in the near future, as the bitcoin’s moving average convergence divergence (MACD) – a momentum indicator based upon price moving averages – is signaling waning bearish pressures.
The MACD usually moves in the direction of the price trend and indicates the strength of a move.
Bitcoin’s weekly MACD, however, has diverged from the primary bearish trend, i.e. the price hit a lower low near $3,100 in December, while the MACD carved out a higher low. A bullish divergence is widely considered a sign of seller exhaustion and is often followed by trend reversal.
As of writing, BTC is changing hands at $3,570 on Bitstamp, having hit highs above $3,700 last week.
Weekly chart
On the weekly chart, the MACD has produced a higher low in favor of the bulls. It is worth noting that a similar bullish divergence was charted over the five months leading up to January 2015, when BTC bottomed out near $150.
So, there is a reason to believe the cryptocurrency is nearing, or has already reached, a major bottom.
As a result, the probability of BTC witnessing a bullish reversal in the next few months is high. A convincing move above the 21-month exponential moving average (EMA) – a level which acted as strong support last year – would confirm a long-term bearish-to-bullish trend change. As of writing, that average is located at $5,334.
Meanwhile, the prospects of a short-term rally to $4,000 would improve if BTC clears the resistance at $3,735.
4-hour chart
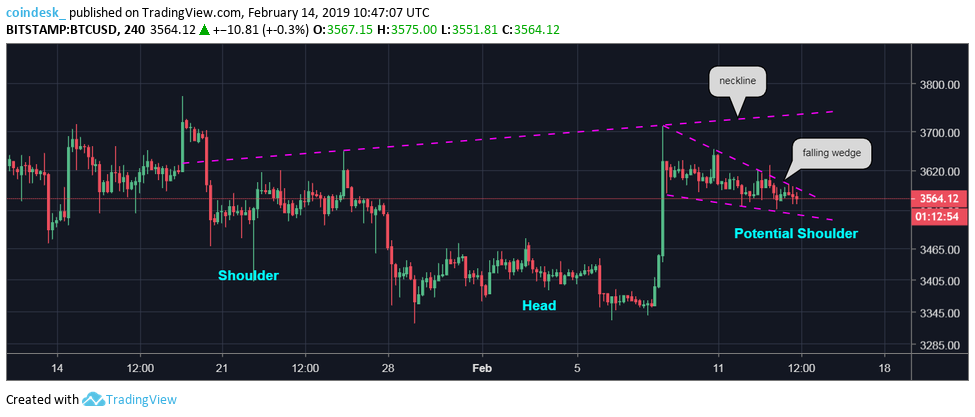
BTC has carved out a falling wedge pattern – a bullish continuation pattern – on the 4-hour chart. A move above $3,585 would confirm a wedge breakout and could yield a rally to $3,735, which is the neckline of the inverse head-and-shoulders bullish reversal pattern. A violation there would open up upside toward $4,100 (target as per the measured move method).
A wedge breakdown, however, would weaken the bullish case put forward by last Friday’s high-volume bullish breakout and shift risk in favor of a drop to $3,400.
Disclosure: The author holds no cryptocurrency assets at the time of writing.
Bitcoin image via Shutterstock; charts by Trading View