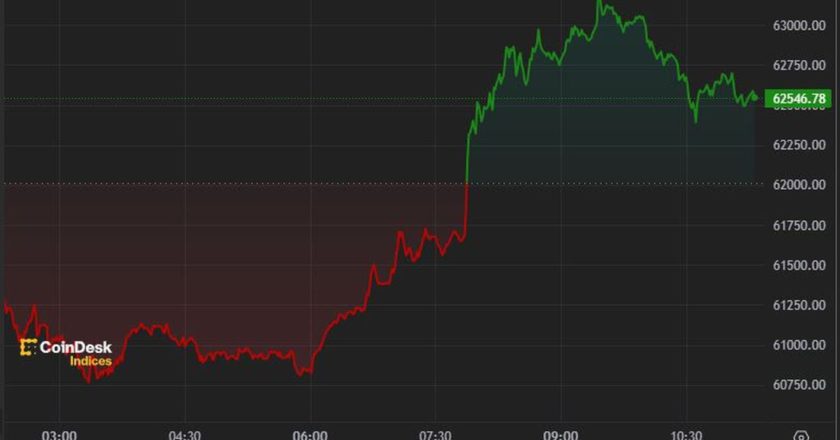
On Monday, Bitcoin’s short-term outlook worsened after the price fell to an intra-day low at $45,672, a far cry from the weekend’s promising rally above the $50,000 level.
With the year nearly complete, and all-time highs nearly 33% away, traders are most likely readjusting their expectations and pushing the $100,000 BTC target a bit further into 2022.
Day traders, 4-hour chart watchers and over-leveraged longs are likely freaking out (unless they went short from $50,000 over the weekend or at this morning’s weakness), but let’s zoom out a little bit to see where Bitcoin price stands.
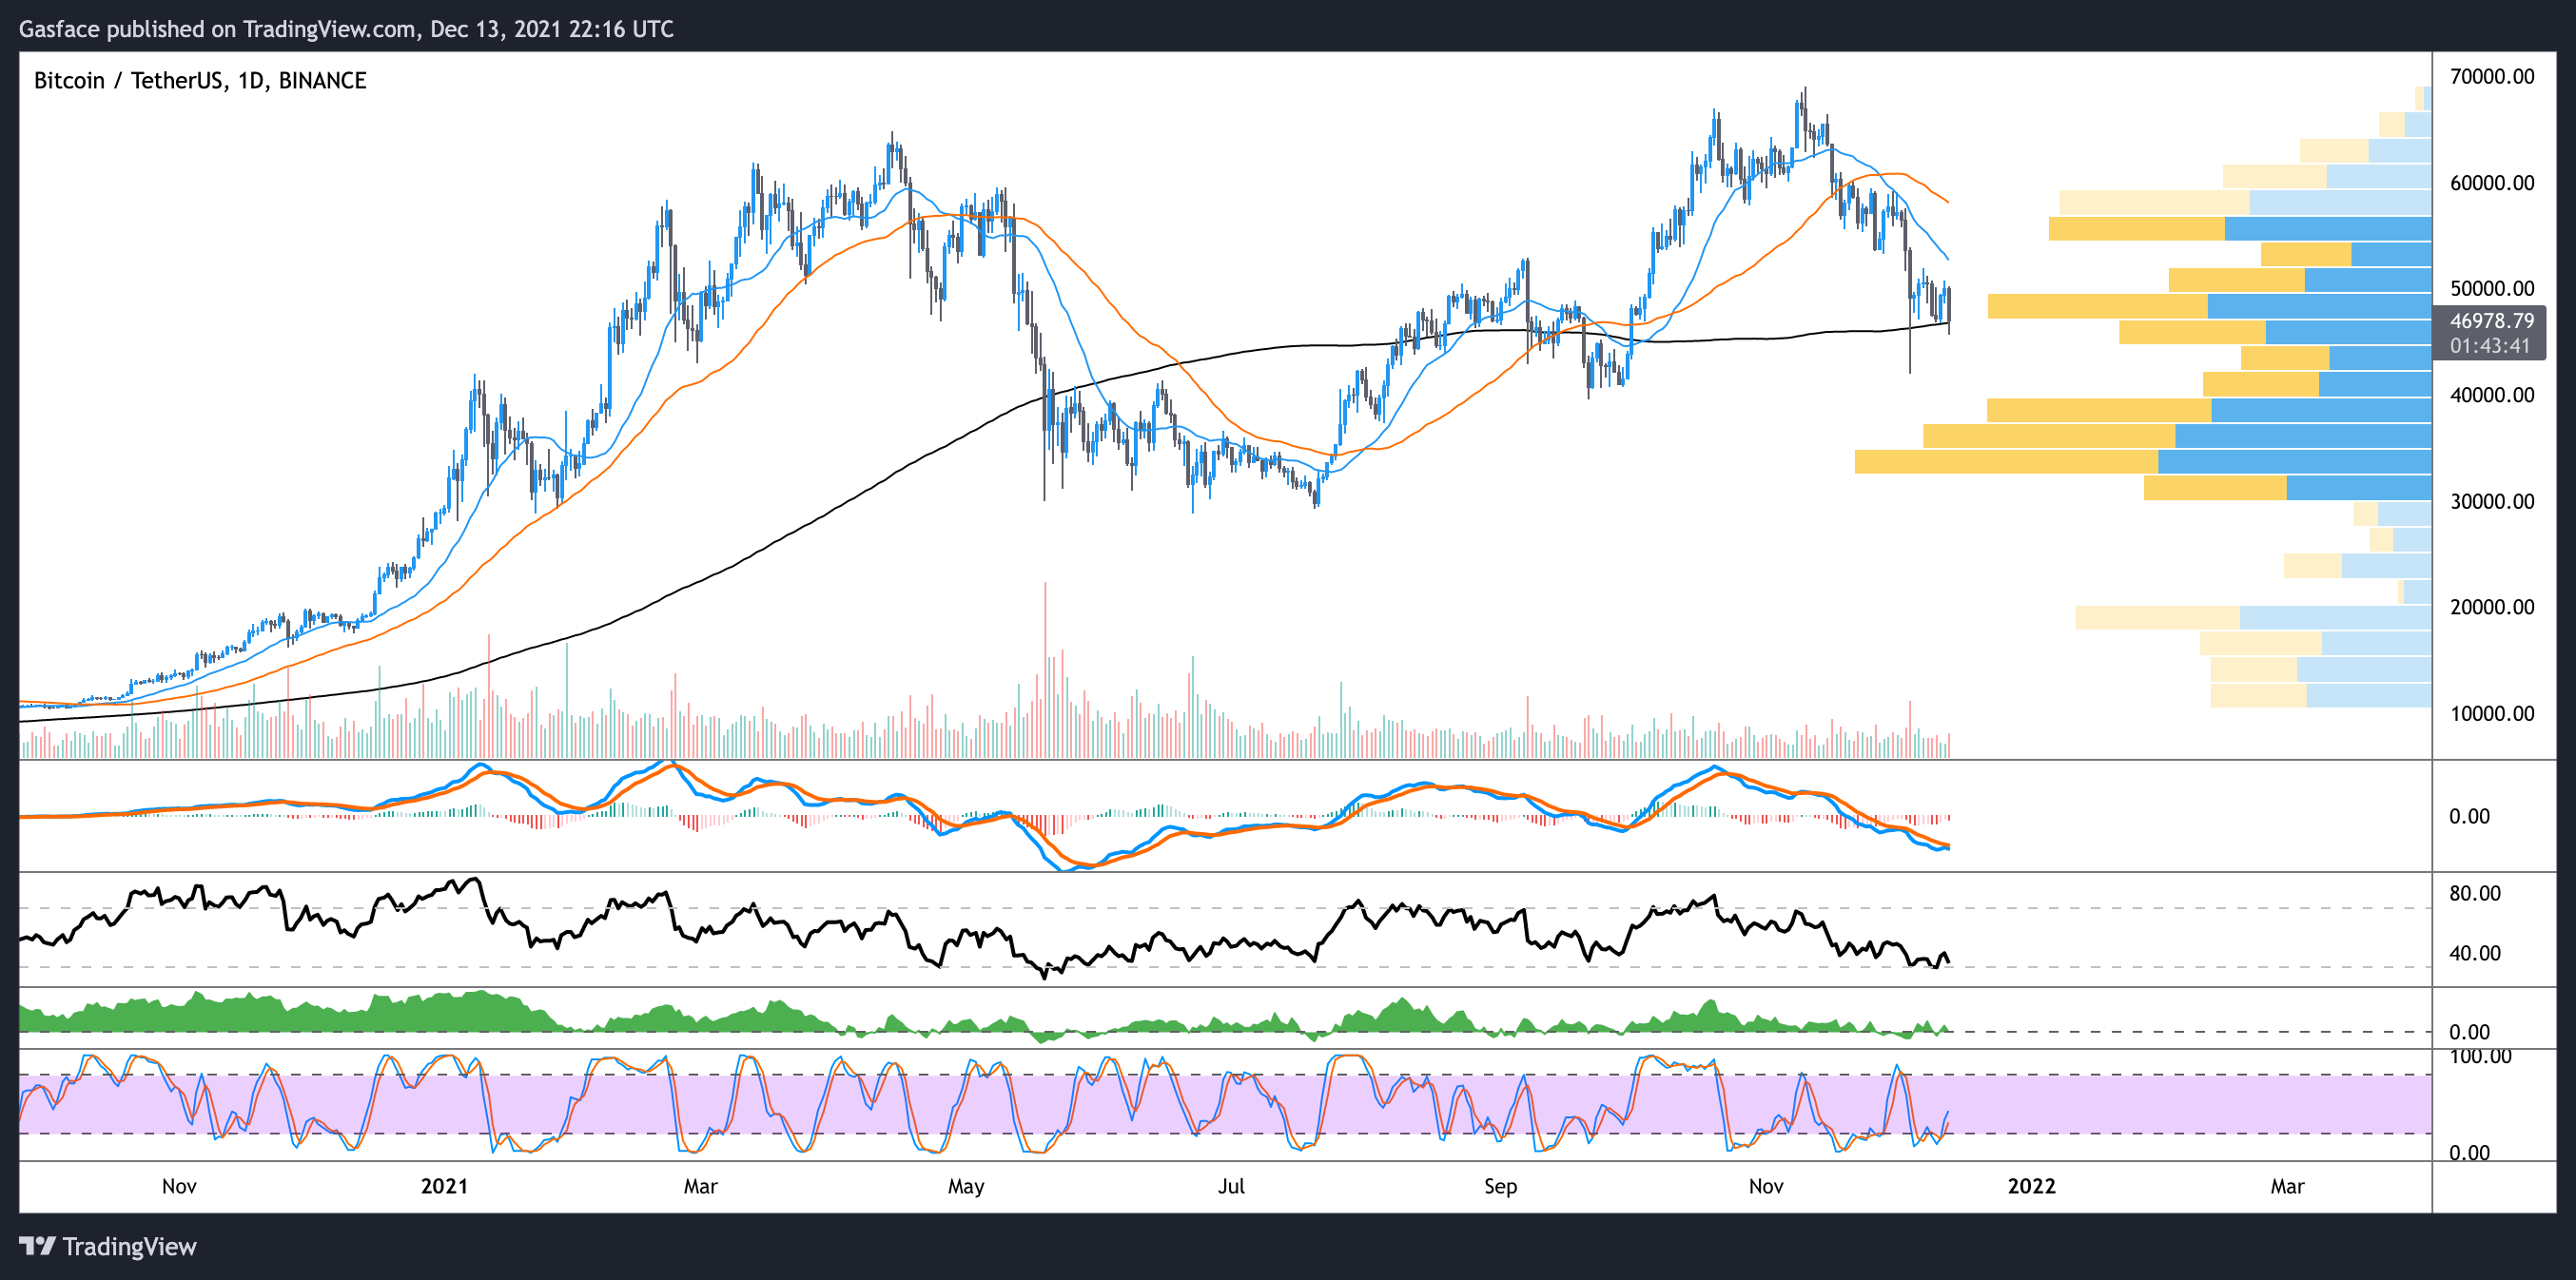
On the daily timeframe, we can see the price struggling to breakout away from the trend of daily lower highs and aside from the Dec. 4 drop to $42,000, traders appear apprehensive to buy into the most recent dips.
Tracking moving averages has always been a relatively simple way to swing trade BTC and currently the 20-day moving average (blue) is below the the 50-day MA (orange). Some traders simply buy when an asset secures a few daily closes above the 20-MA and sell when the price falls below it because this is a sign that the short-term trend is weakening.
Following this practice, momentum traders might wait for BTC to secure a daily close above the moving average at $53,000 before opening new long positions. More risk averse traders might consider waiting for convergence between the 20- and 50-MA as a clearer sign of a trend reversal. Taking a quick look at the last year of price action proves that the strategy is pretty effective.
Why some traders expect more downside
More experienced traders know that Bitcoin price has a tendency to make double tops, M-tops and head and shoulders patterns after hitting new all-time highs. Lately, analysts on crypto Twitter have pointed to what they perceive to be a double top, which is a clear trend reversal pattern.
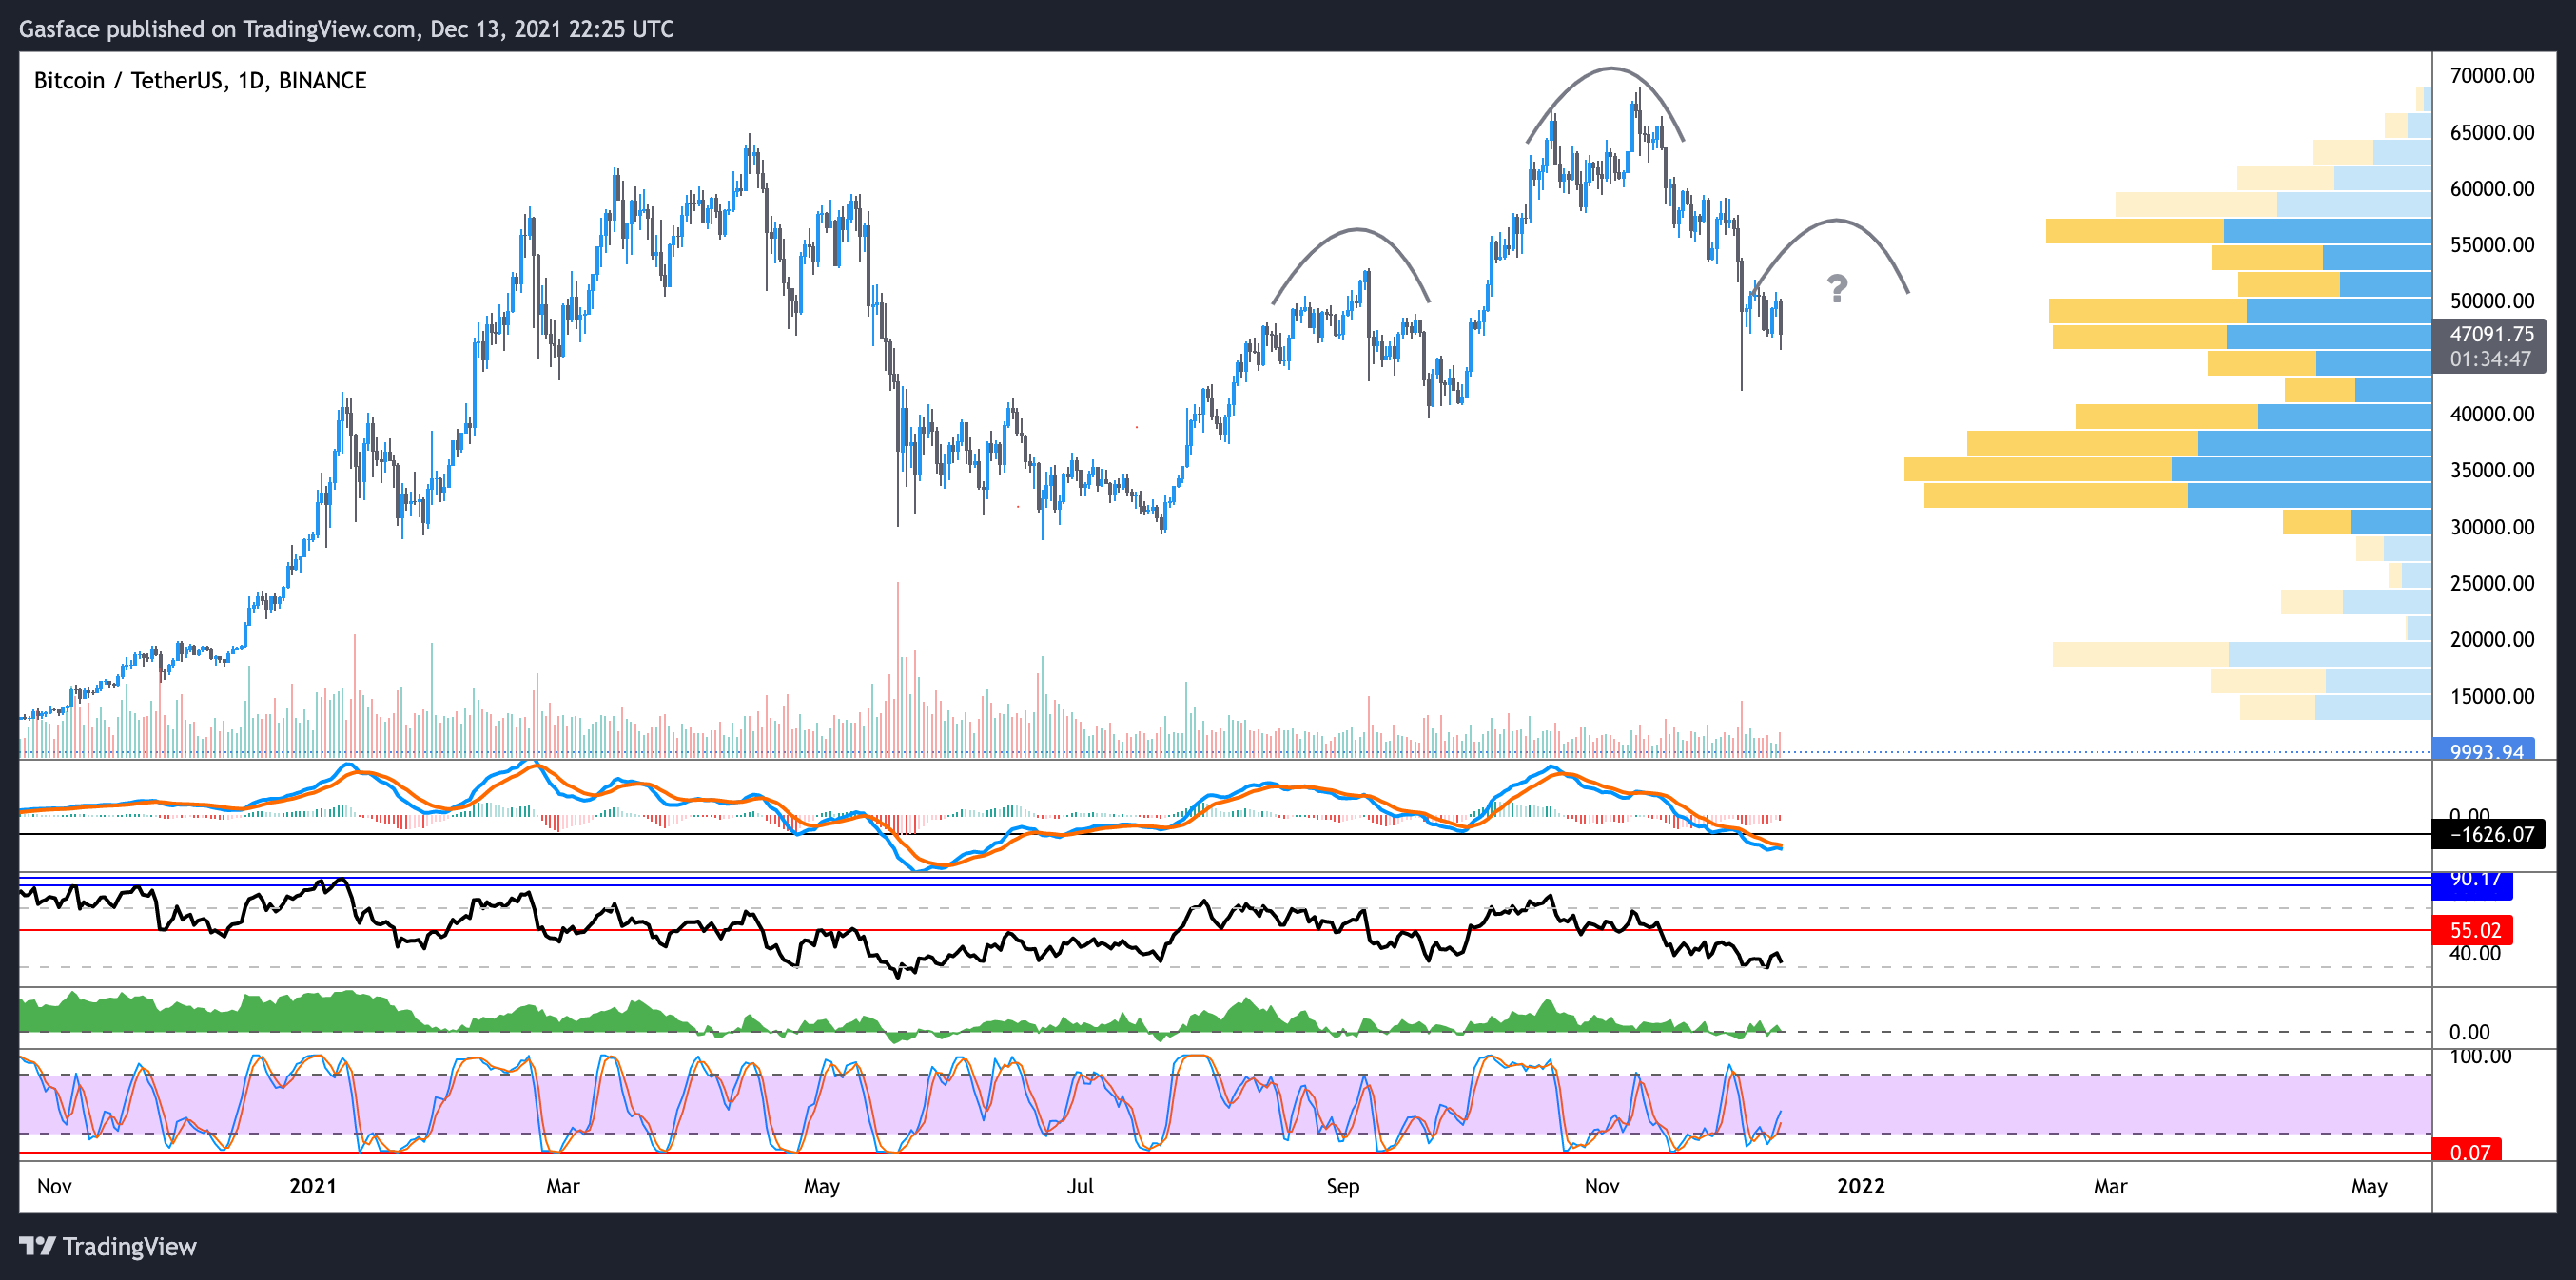
Looking at the daily time frame, we can begin to see what looks like the start of a head and shoulders pattern. The current dips and following consolidation could eventually complete the right shoulder, with a neckline at $41,500, and a price target near a number so unbelievably low that it won’t be written here.
Traders will also notice that the neckline of said head and shoulders pattern aligns with a wide gap on the Volume Profile Visible Range (VPVR) indicator, which shows increased buying interest right at the $40,000 level.
At the moment, it’s too early to make too much fuss about the existence of a H&S pattern, especially since analysis of price action cannot be determined by a single indicator, but it is still something worth noting.
$BTC S/R update according to Volume Profile:
$47k has been a good support lately but if we break it, our next strong support is at $40k.
On the other hand, if we are able to break $50.6k resistance the next one is all the way at $56k.
Let’s see which set up is going to play out! pic.twitter.com/hcmvmUbVln— whalemap (@whale_map) December 11, 2021
Data from an on-chain analysis outlet, Whalemap, also pinpoints the $40,000 level as an area to watch closely. While speaking to Cointelegraph, Whalemap co-founder Andy Bohutsky said,
“Basically, if we start closing daily candles below the support outlined above, we will probably go to a lower one. The closest below us is around $40,000.”
While Bitcoin’s current price action does little to inspire confidence in traders who bought higher or expected price to trade in the $74,000 to $80,000 range in December, analyst Mohit Sorout recently pointed out that phases of negative funding have proven to be great buying opportunities.
There is no downside on this asset$btc pic.twitter.com/Vr7mPFOvxU
— Mohit Sorout (@singhsoro) December 11, 2021
On the daily timeframe the moving average convergence divergence (MACD) and Relative Strength Index (RSI) are also oversold, both of which have historically pointed to accumulation phases and good opportunities to dollar cost average into fresh long positions.
The views and opinions expressed here are solely those of the author and do not necessarily reflect the views of Cointelegraph.com. Every investment and trading move involves risk, you should conduct your own research when making a decision.