Altcoins continue to trend higher but Bitcoin price needs to turn $35,000 to support in order for the entire market to gain momentum.
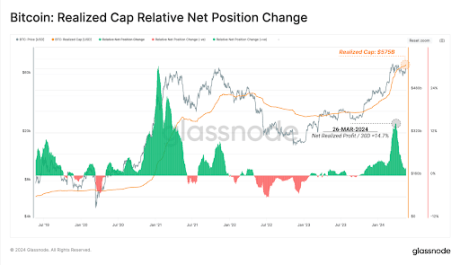
After the recent correction, Bitcoin (BTC) will need aggressive inflows to absorb the possible selling from the short-term traders and momentum players as the price nears $40,000. In the past few months, Grayscale Investments has been one of the major entities responsible for the pick up in demand.
However, JPMorgan analysts pointed out in a recent note that Grayscale inflows “appear to have peaked” on a four-week rolling average basis. Without a strong tailwind from the institutional investors, many analysts believe Bitcoin may not break above $40,000.
The failure to resume the uptrend does not mean Bitcoin will plunge and enter a bear market similar to the one seen in 2018. Lower levels continue to attract investments from institutions and the latest to disclose a position in Bitcoin is Nevada-based crypto mining firm Marathon Patent Group. The company has purchased $150 million worth of Bitcoin at an average price of $31,168.
Even if Bitcoin remains range-bound for the next few days, select altcoins could continue to move toward new highs.
Let’s study the charts of the top-10 cryptocurrencies to spot the ones that are in a bull trend.
BTC/USD
Bitcoin has broken above the 20-day exponential moving average ($33,851) today, indicating accumulation at lower levels. The current up-move could rise to the downtrend line where the bulls are likely to face stiff resistance from the bears.
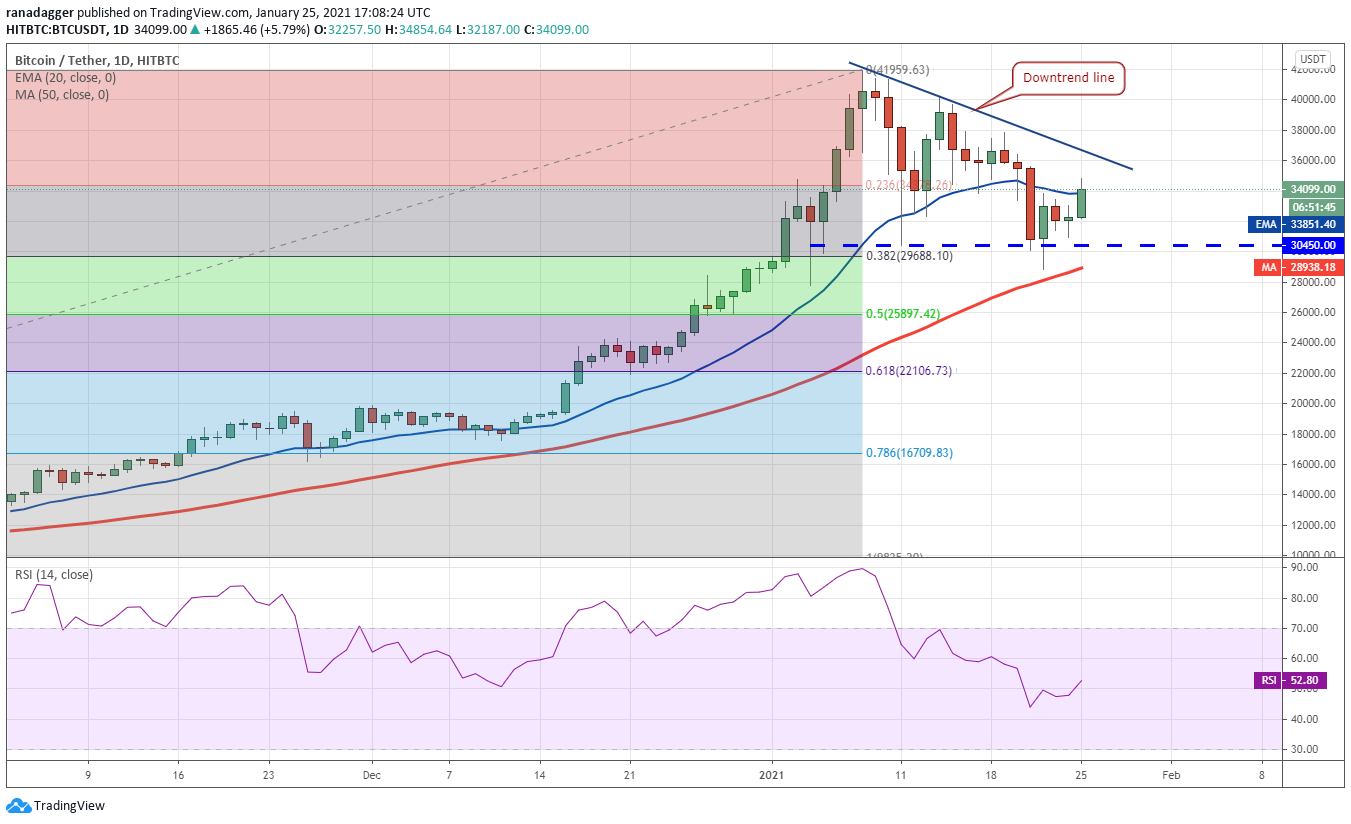
The flat 20-day EMA and the relative strength index (RSI) just above the midpoint suggest a balance between supply and demand.
If the price reverses direction from the downtrend line, the bears will again try to sink and sustain the BTC/USD pair below the $30,450 support. If they succeed, the pair will complete a descending triangle pattern, which has a target objective at $18,940.37.
Contrary to this assumption, if the bulls drive the price above the downtrend line, the aggressive bears who may have sold short in the past few days could cover their positions, resulting in a short squeeze. Above the downtrend line, the pair could rise to $40,000 and then to $41,959.63.
ETH/USD
Ether (ETH) surged above the $1,350 resistance on Jan. 24 and followed it up with another up-move today, hitting a new all-time high at $1,473.096. However, the long wick on today’s candlestick suggests profit-booking at higher levels.
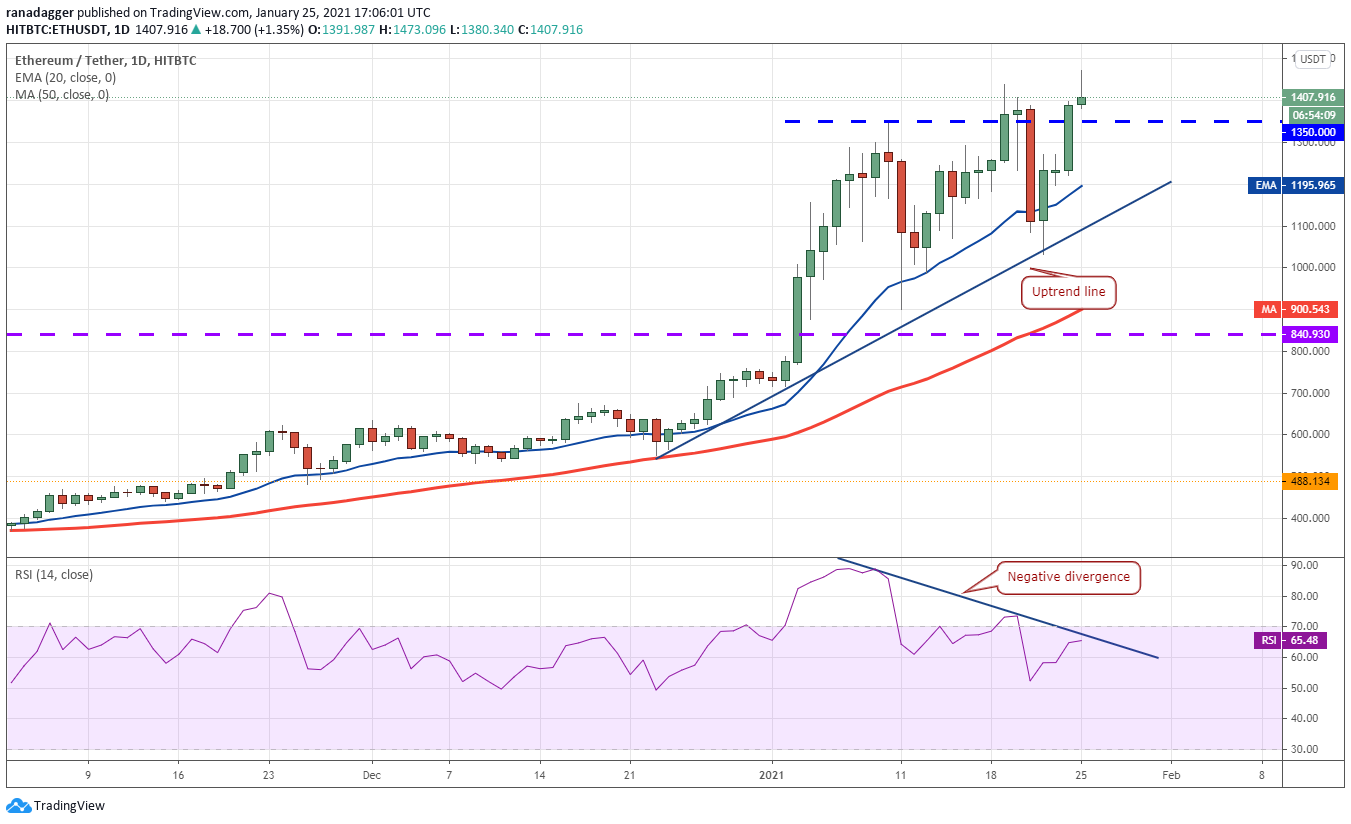
The RSI has also formed a negative divergence, which suggests the momentum may be weakening. If the bears sink the price below the $1,350 support, the ETH/USD pair could drop to the 20-day EMA ($1,195).
A strong rebound off the 20-day EMA will indicate that the bulls are accumulating on dips. The buyers will then try to resume the uptrend. If they can push the price above $1,500, the pair could rise to $1,675.
On the contrary, if the bears sink the price below the uptrend line, the pair may drop to the next support at $840, signaling a trend change.
DOT/USD
Polkadot (DOT) has formed a Doji candlestick pattern today with a long wick, which suggests the bears are attempting to stall the current up-move at $19.40. However, the rising moving averages and the RSI near the overbought territory suggests the bulls are in control.
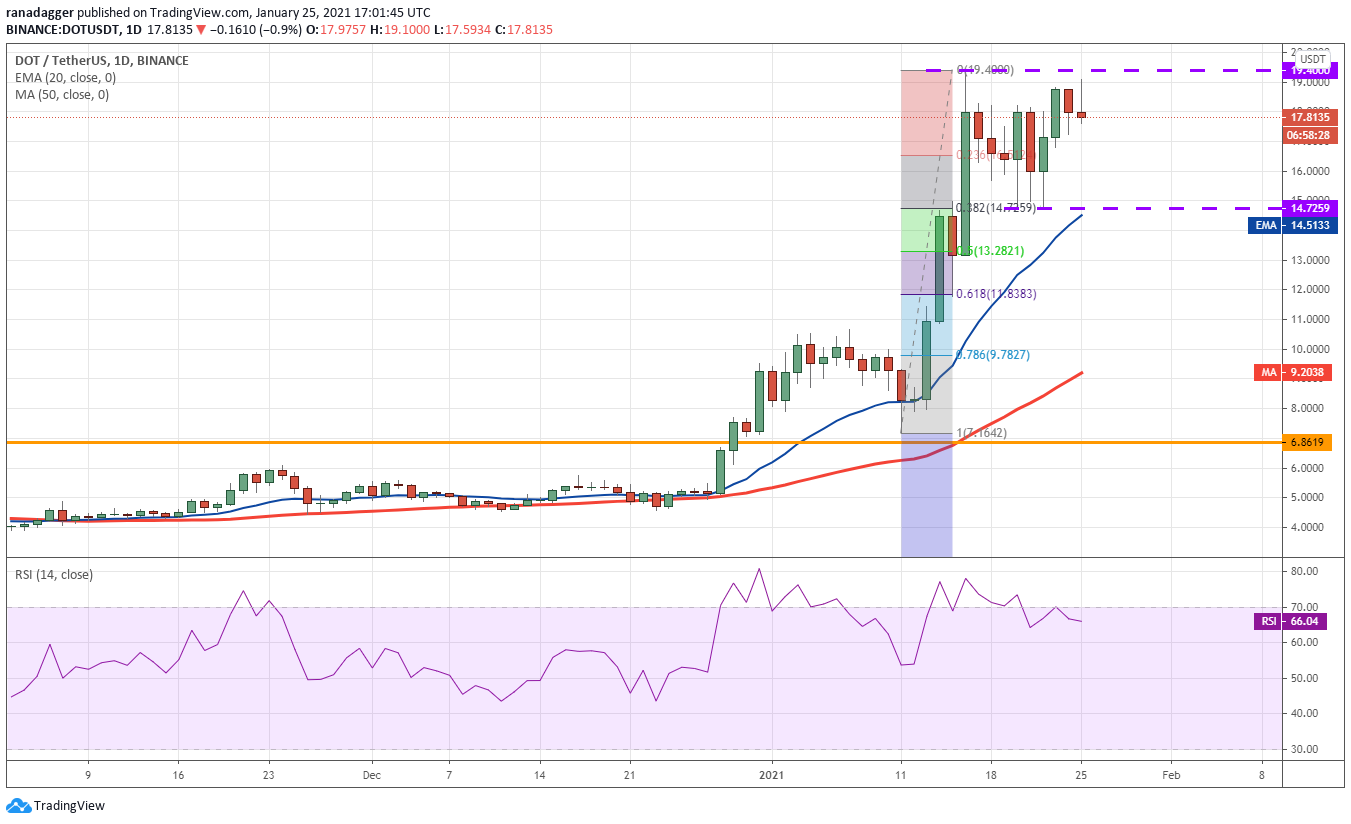
If the bulls do not give up much ground from the current level, it will suggest the buyers are absorbing the supply and that will increase the possibility of a breakout above $19.40. If that happens, the DOT/USD pair could resume the uptrend and rally to the next target objective at $24 and then to $30.
Contrary to this assumption, if the bears sink the price below $16.7951, the pair may drop to the 20-day EMA ($14.51). A strong rebound off this support will keep the uptrend intact and the bulls will again attempt to resume the uptrend. On the other hand, if bears sink the price below the 20-day EMA, it will suggest a trend change.
XRP/USD
The daily trading range in XRP has shrunk over the past two days. The gradually downsloping moving averages and the RSI in the negative territory suggest a minor advantage to the bears.
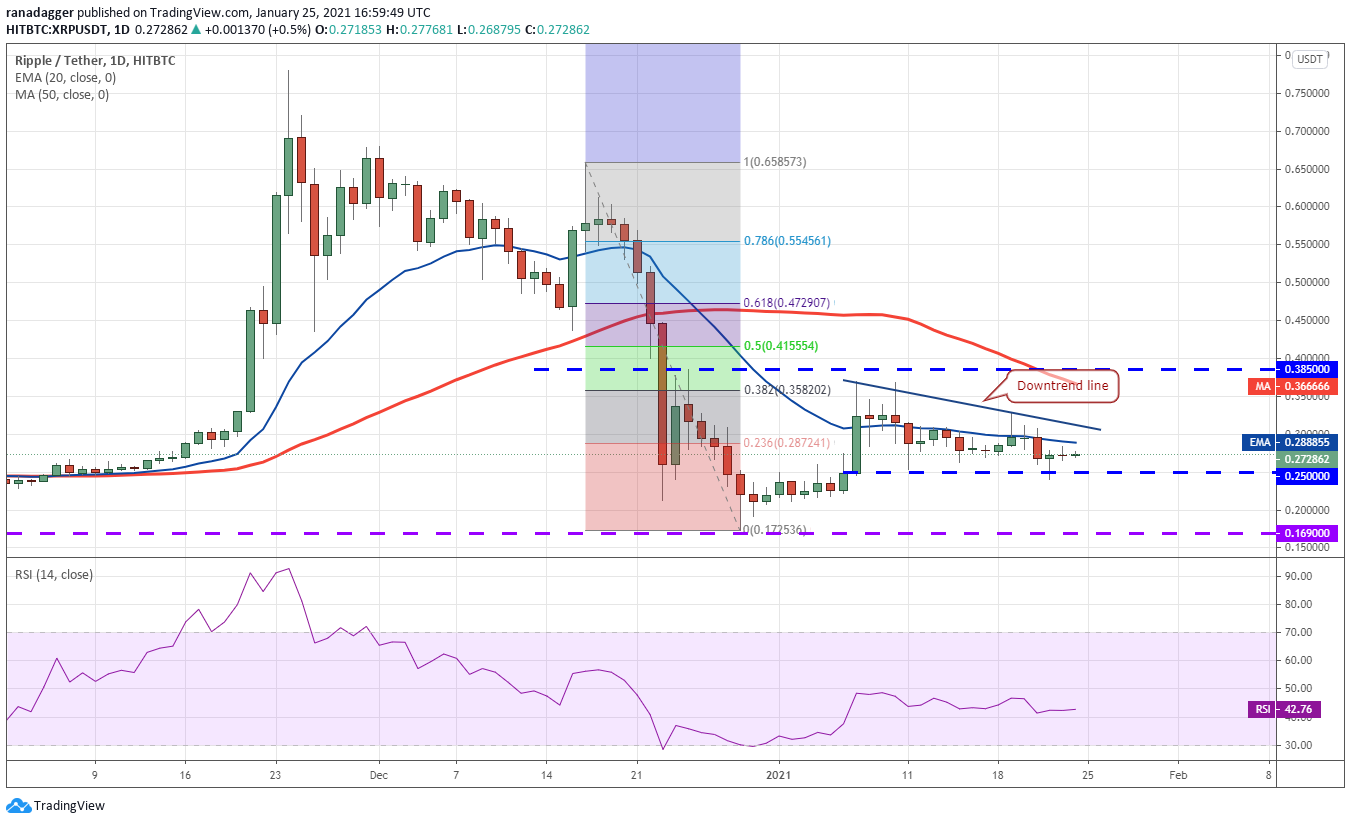
The Doji candlestick pattern on Jan. 24 and today signals indecision among the bulls and the bears. If the uncertainty resolves to the downside and the bears sink the price below $0.25, the XRP/USD pair will complete a bearish descending triangle pattern that could result in a drop to $0.169.
On the contrary, if the pair rises from the current levels and breaks above the downtrend line, it could result in a rally to $0.385.
ADA/USD
Cardano (ADA) continues to trade inside the ascending channel and the price has been sustaining above the $0.34 support for the past two days, which is a positive sign. This suggests the traders are not hurrying to book profits on relief rallies.
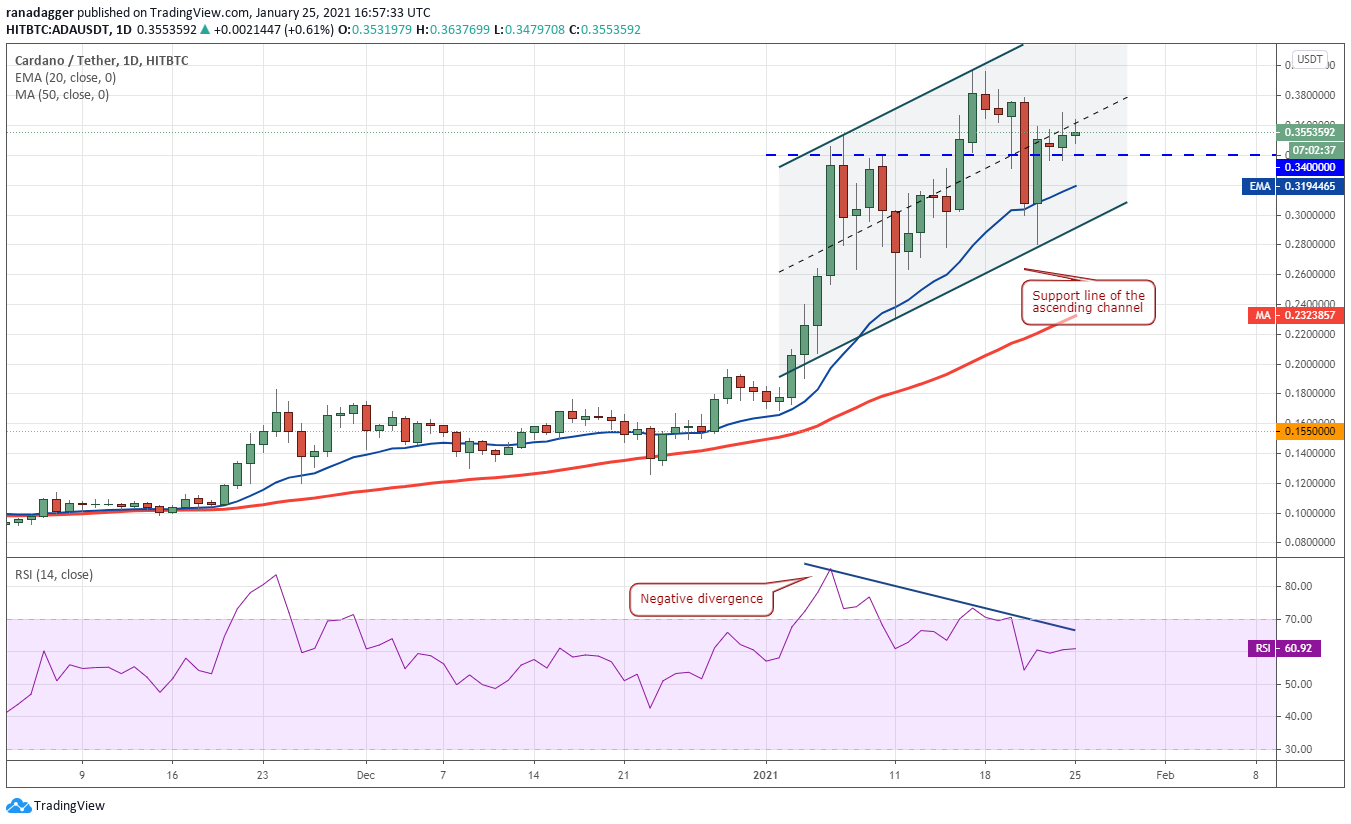
The bulls will now try to push the price to $0.3971995. A breakout and close above the $0.40 resistance could start the next leg of the up-move that could reach $0.50. The ADA/USD pair could further pick up momentum if the bulls can thrust the price above the channel.
Both moving averages are sloping up and the RSI is above 60, which suggests the bulls have the upper hand. Contrary to this assumption, if the pair turns down from the current levels and breaks below $0.34, it will suggest traders are booking profits on rallies. A break below the support line of the channel may signal a trend change.
LINK/USD
Chainlink (LINK) soared to a new all-time high on Jan. 23 but the bulls have not been able to build upon the momentum since then. The altcoin formed a hanging man candlestick pattern on Jan. 24, which suggested the bulls may be tiring out.
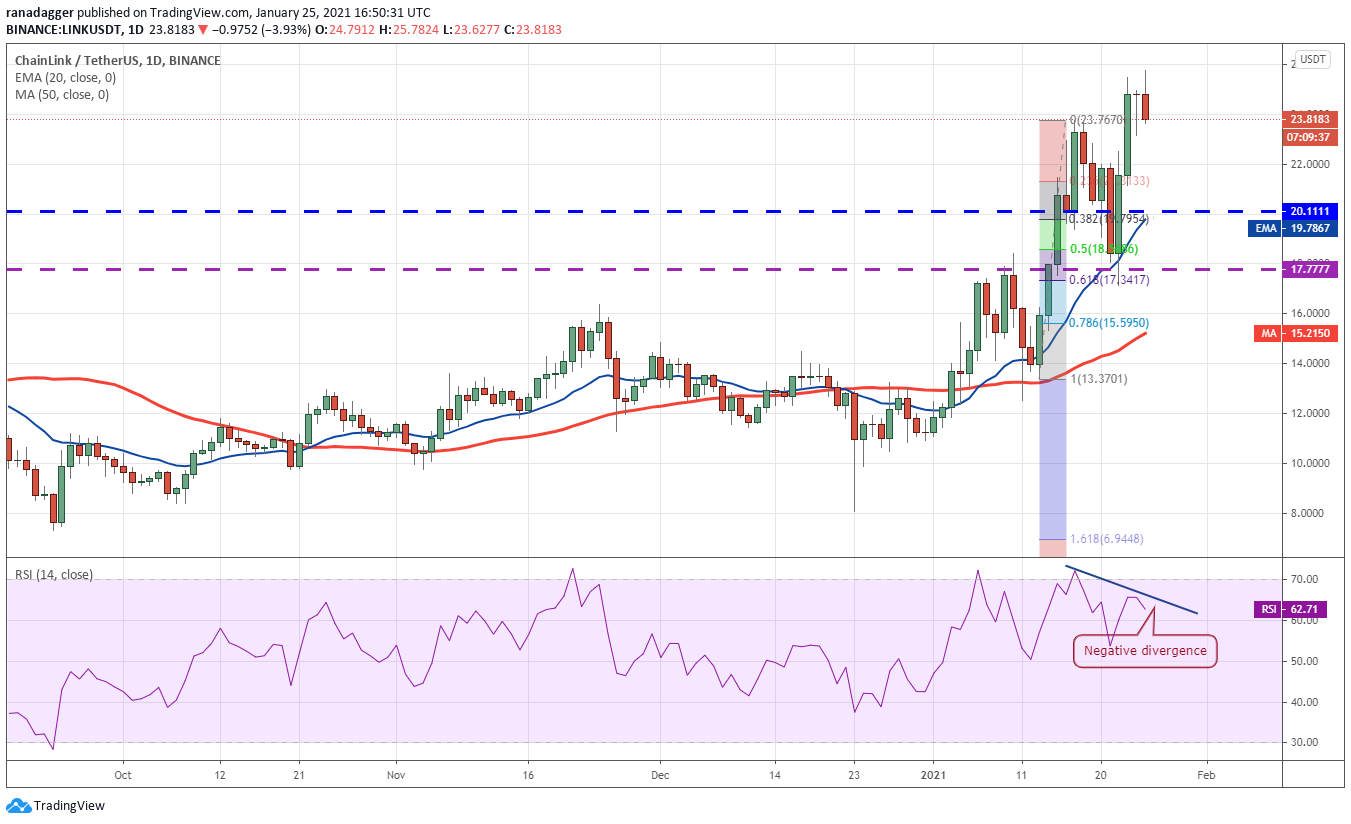
The negative divergence on the RSI also indicates that the bullish momentum may be weakening.
The buyers attempted to resume the up-move today but the LINK/USD pair is facing profit-booking at higher levels. If the pair breaks below $23.1612, a drop to the critical support at $20.1111 is possible.
On the other hand, if the pair turns up from the current level and rises above $26, it will suggest the bulls are back in command. The next target on the upside is $30.
LTC/USD
Litecoin (LTC) bounced off the 50-day simple moving average ($126) on Jan. 22 and broke above the 20-day EMA ($143) today but the long wick on the candlestick suggests the bears are aggressively defending the downtrend line.
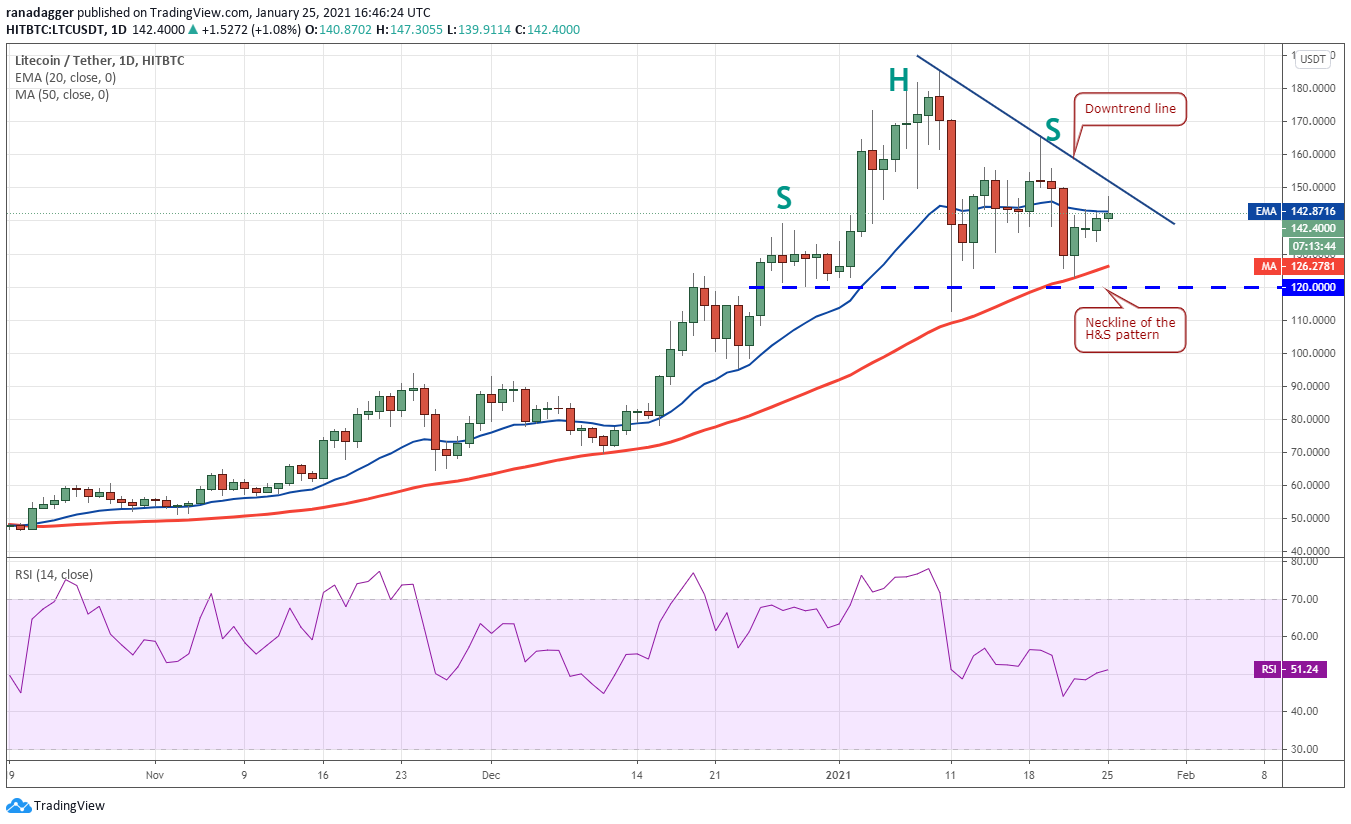
If the price turns down from the downtrend line, the bears will again try to break the $120 support. If they succeed, the LTC/USD pair will complete a bearish head and shoulders pattern that may pull the price down to $100 and then to $70.
Conversely, if the bulls can push the price above the downtrend line, the pair may rise to $165.9709 and then retest the $185.5821 resistance. A breakout of this level could resume the uptrend.
However, the flat 20-day EMA and the RSI just above the midpoint are not signaling a clear advantage either to the bulls or the bears. The indicators suggest the pair may consolidate for a few more days.
BCH/USD
Bitcoin Cash (BCH) is currently attempting to rise and sustain above the 20-day EMA ($454). If successful, the altcoin could rise to $539. A breakout and close above this resistance could result in a retest of $631.71.
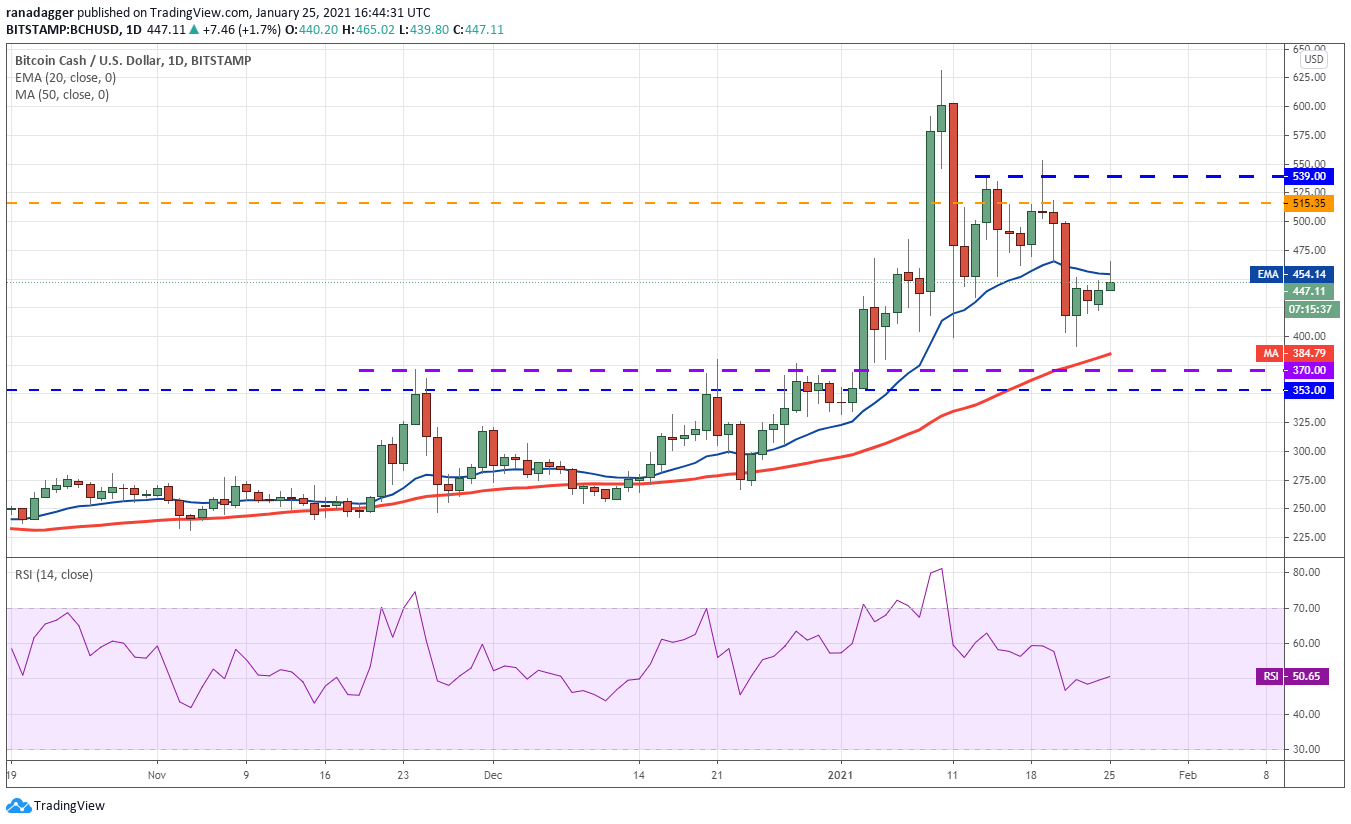
Conversely, if the bulls fail to sustain the price above the 20-day EMA, the bears may again sink the price to the support of the range at $370. A breakdown and close below $353 could pull the price down to $275.
The indicators are currently not indicating an advantage to either the bulls or the bears. The flattish 20-day EMA and the RSI near the midpoint suggest the BCH/USD pair may extend its stay inside the range for a few more days.
BNB/USD
Binance Coin (BNB) bounced off the support line of the ascending broadening wedge pattern on Jan. 22 and the bulls have pushed the price above the 20-day EMA ($41), which is a positive sign.
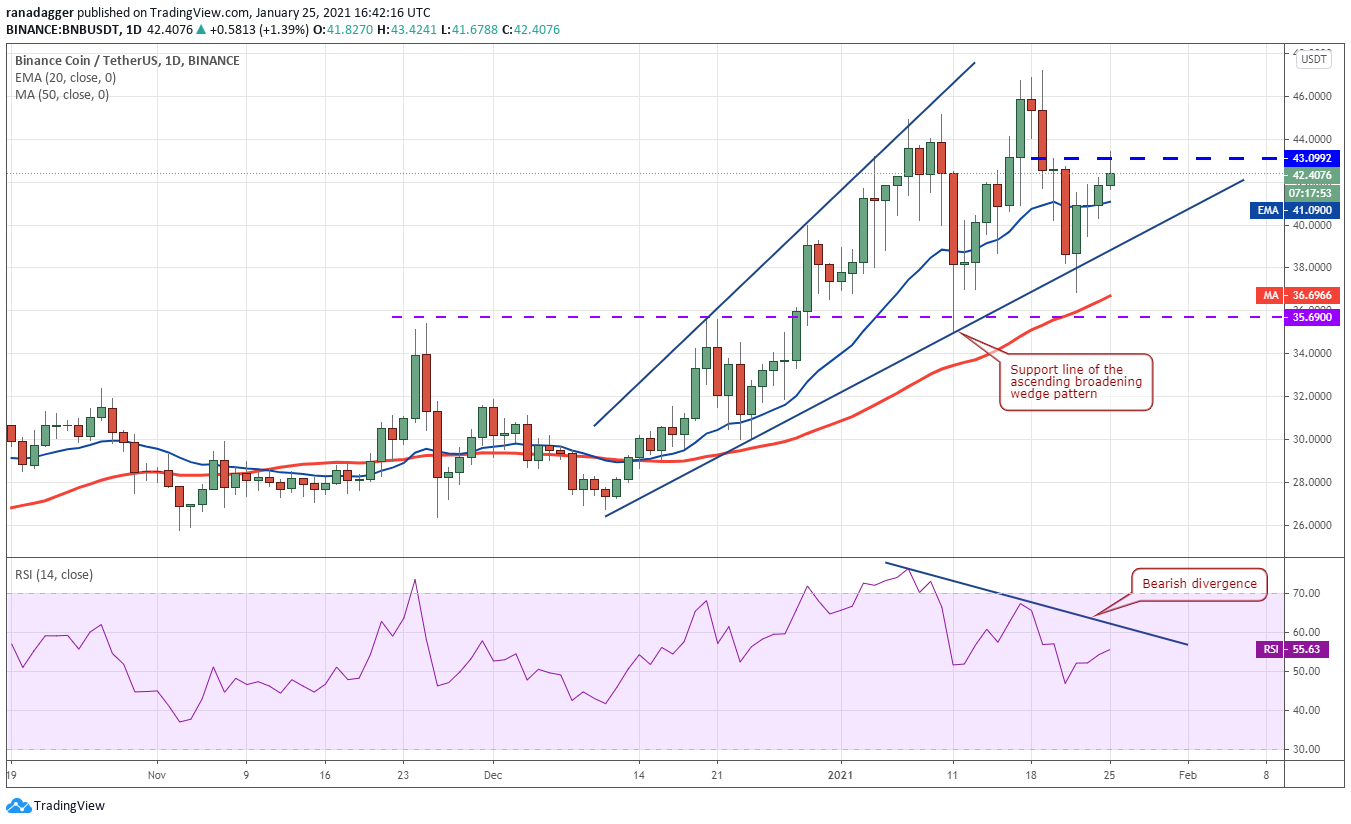
If the bulls can push and sustain the price above $43.0992, the BNB/USD pair could retest the all-time high at $47.2187. A breakout of this resistance could resume the uptrend, with the next target objective at $50.
The 20-day EMA is sloping up gradually and the RSI is just above the midpoint, suggesting a marginal advantage to the bulls.
This positive view will invalidate if the pair turns down from the current levels and breaks below the support line. If that happens, the bearish pattern will complete and could result in a fall to $35.69 and then $30.
XLM/USD
Stellar Lumens (XLM) re-entered the $0.26 to $0.325 range on Jan. 22 and has been sustaining above the 20-day EMA ($0.265) since then. However, the bulls have failed to sustain the recovery and push the price towards the $0.325 resistance, which suggests a lack of demand at higher levels.
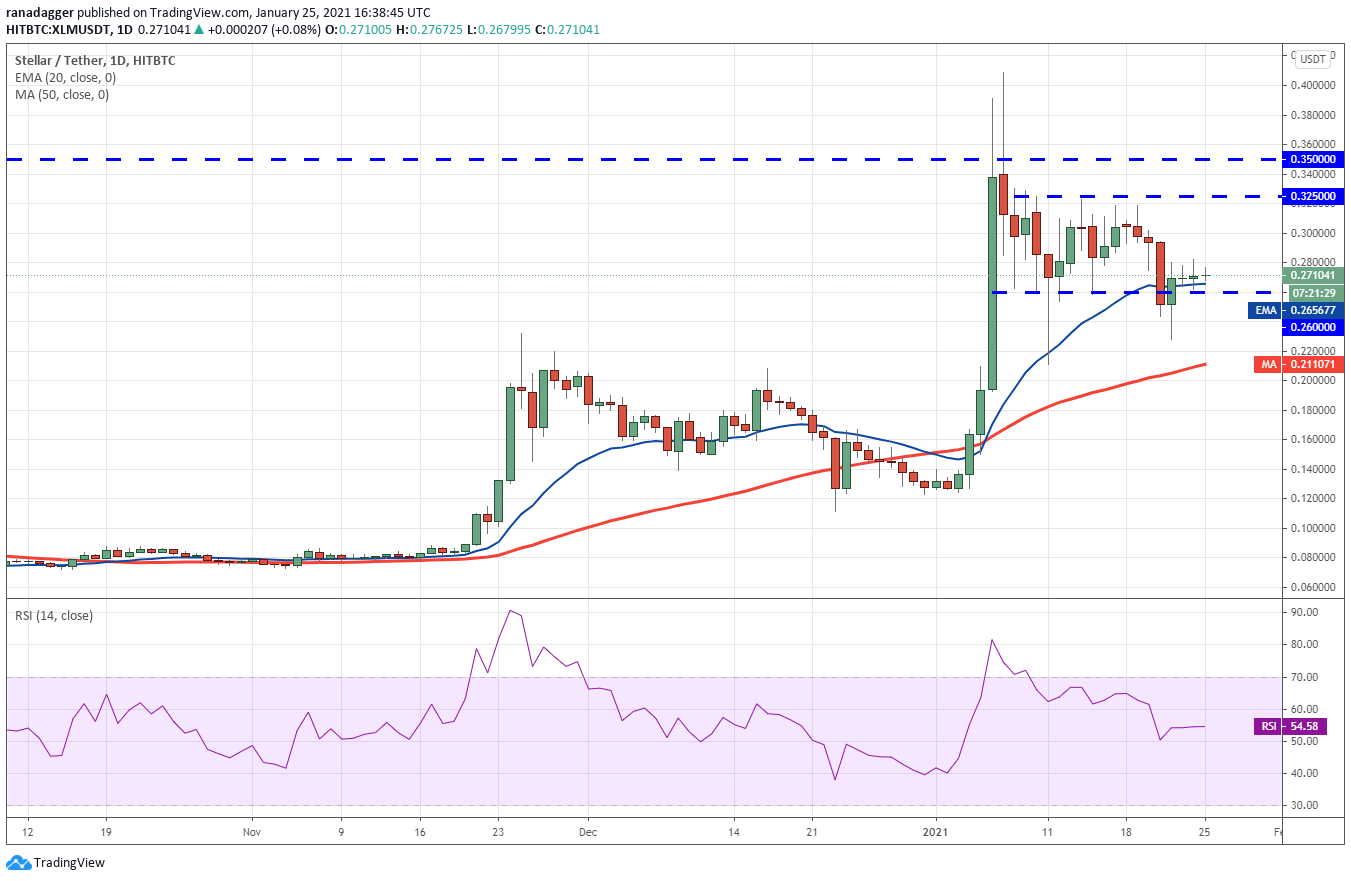
If the XLM/USD pair fails to rise and sustain above $0.282 in the next few days, the bears may again try to sink the price below the $0.26 support. If they succeed, the pair may drop to the 50-day SMA ($0.211).
Such a move will suggest the momentum has weakened. The flattish 20-day EMA and the RSI just above the midpoint also indicate a balance between supply and demand.
If the bulls push the price above $0.282, the pair may rise to $0.30 and then to $0.325. The bears may mount a stiff resistance at this level and if the pair turns down from $0.325, it may continue the range-bound action for a few more days.
The views and opinions expressed here are solely those of the author and do not necessarily reflect the views of Cointelegraph. Every investment and trading move involves risk. You should conduct your own research when making a decision.
Market data is provided by HitBTC exchange.