The SEC’s lawsuit against Ripple may be bearish for a few altcoins but could be bullish for Bitcoin.
The current crypto bull run has been spearheaded by Bitcoin (BTC). As the United States Securities and Exchange Commission has previously hinted that Bitcoin is not a security, the regulator’s current lawsuit against Ripple is unlikely to stop the institutional inflow of money into Bitcoin.
However, a few altcoins that may be at risk of facing a similar fate as Ripple could face selling pressure. Due to a change in sentiment, retail investors may sell some of their altcoin holdings and shift to Bitcoin.
Even retail investors who plan to spend their stimulus checks for buying crypto-assets may prefer Bitcoin over altcoins. So, while XRP faces selling pressure, the lawsuit may prove to be bullish for Bitcoin.
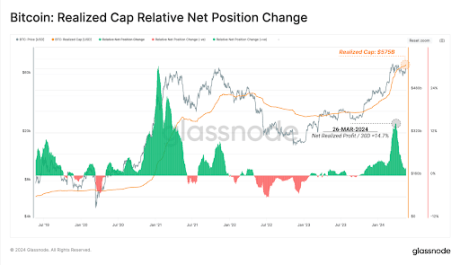
The institutions have been pumping money into Bitcoin at an unprecedented pace. Grayscale continued its buying spree and added 12,319 Bitcoin on Tuesday. That means Grayscale gobbled up about 44% of all the newly mined BTC in a month or around 28,000 Bitcoin.
Bitcoin’s supply is not able to keep up with the institutional demand and if retail traders also turn net buyers, the price is only likely to boost further.
Let’s look at the charts of the top-10 cryptocurrencies and establish their major trend.
BTC/USD
In a strong uptrend, the corrections usually last for about one to three days. Bitcoin closed in the red on Dec. 20 and 21 but the price turned up on Dec. 22 and the bulls are currently attempting to resume the up-move.
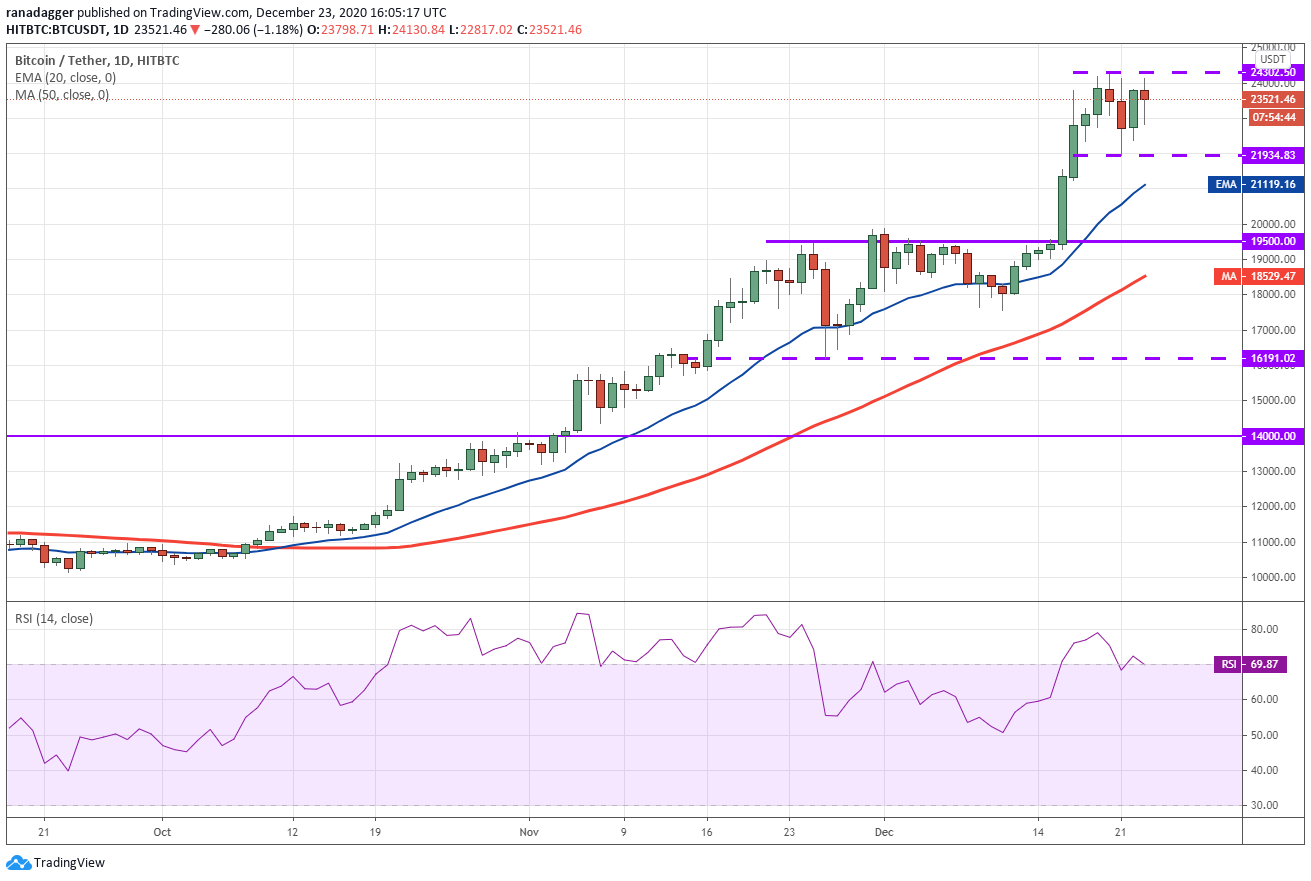
If the bulls can push the price above $24,302.50, the BTC/USD pair could rally to $26,958. The upsloping moving averages and the relative strength index (RSI) close to the overbought zone suggest bulls are in control.
However, if the bears defend the overhead resistance level, the pair may consolidate in a tight range of $21,934.83 to $24,302.50 before starting the next move.
Contrary to this bullish assumption, if the pair turns down and breaks below $21,934.83, a drop to $20,000 is possible. The zone between $19,500 and $20,000 is crucial because if it cracks, the pair may drop to the 50-day simple moving average ($18,529).
ETH/USD
The bulls are aggressively defending the 20-day exponential moving average ($603). Although Ether (ETH) rose above the $622.807 resistance on Dec. 22, the price has turned down once again today. This suggests that demand dries up at higher levels.
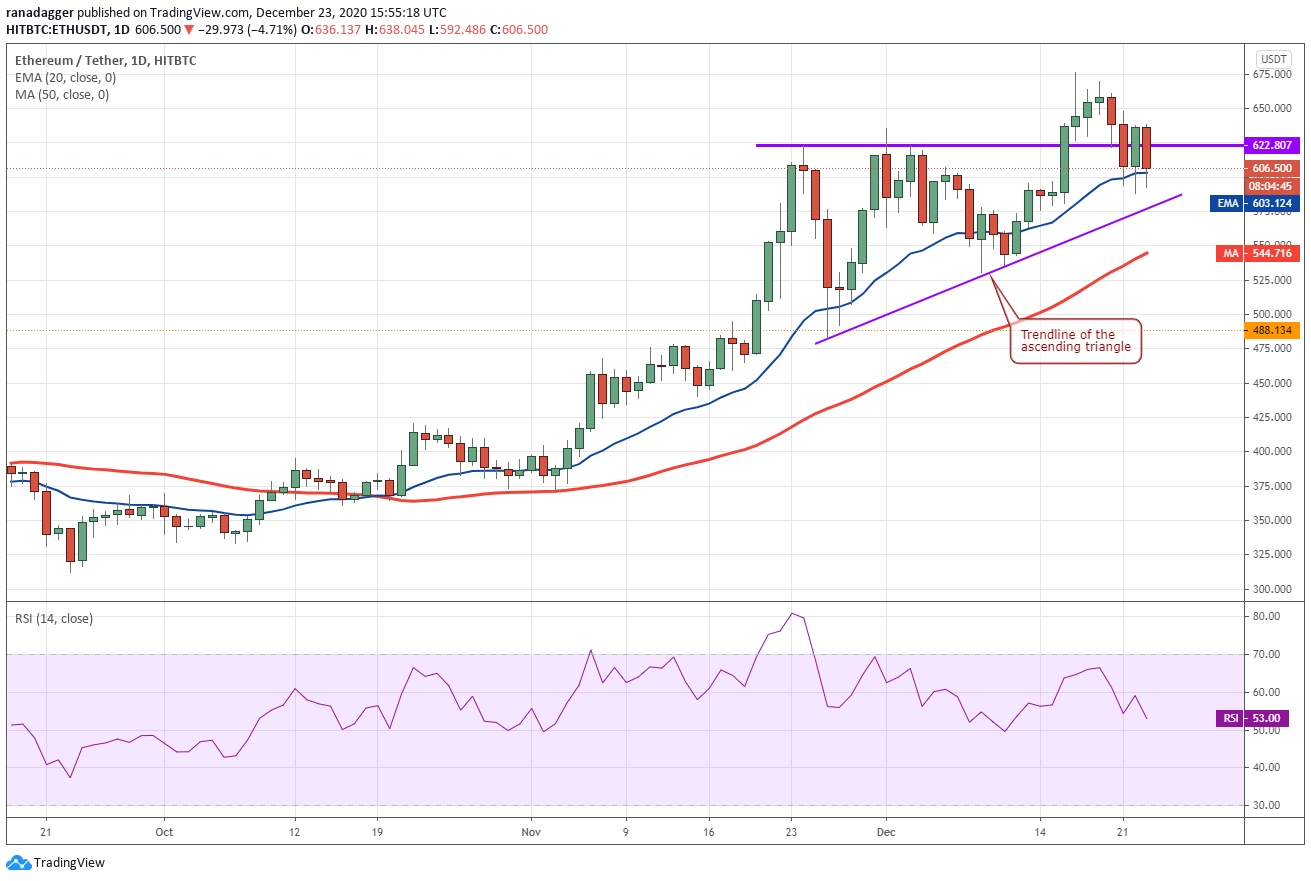
However, the bulls are currently attempting to defend the 20-day EMA. If they succeed, the ETH/USD pair could make one more attempt to rise above $640 and retest $676.325.
The upsloping moving averages and the RSI in the positive territory suggest that bulls have the upper hand. A breakout of $676.325 may start the next leg of the uptrend, which has a target objective at $763.614.
Conversely, if the price dips below the trendline of the triangle, the pair could extend the decline to $540 and then to $480.
XRP/USD
The bulls defended the $0.425 to $0.40 support on Dec. 22 but renewed selling today has broken the range. XRP has plunged below the $0.326724 support but bulls may attempt to provide support at lower levels.
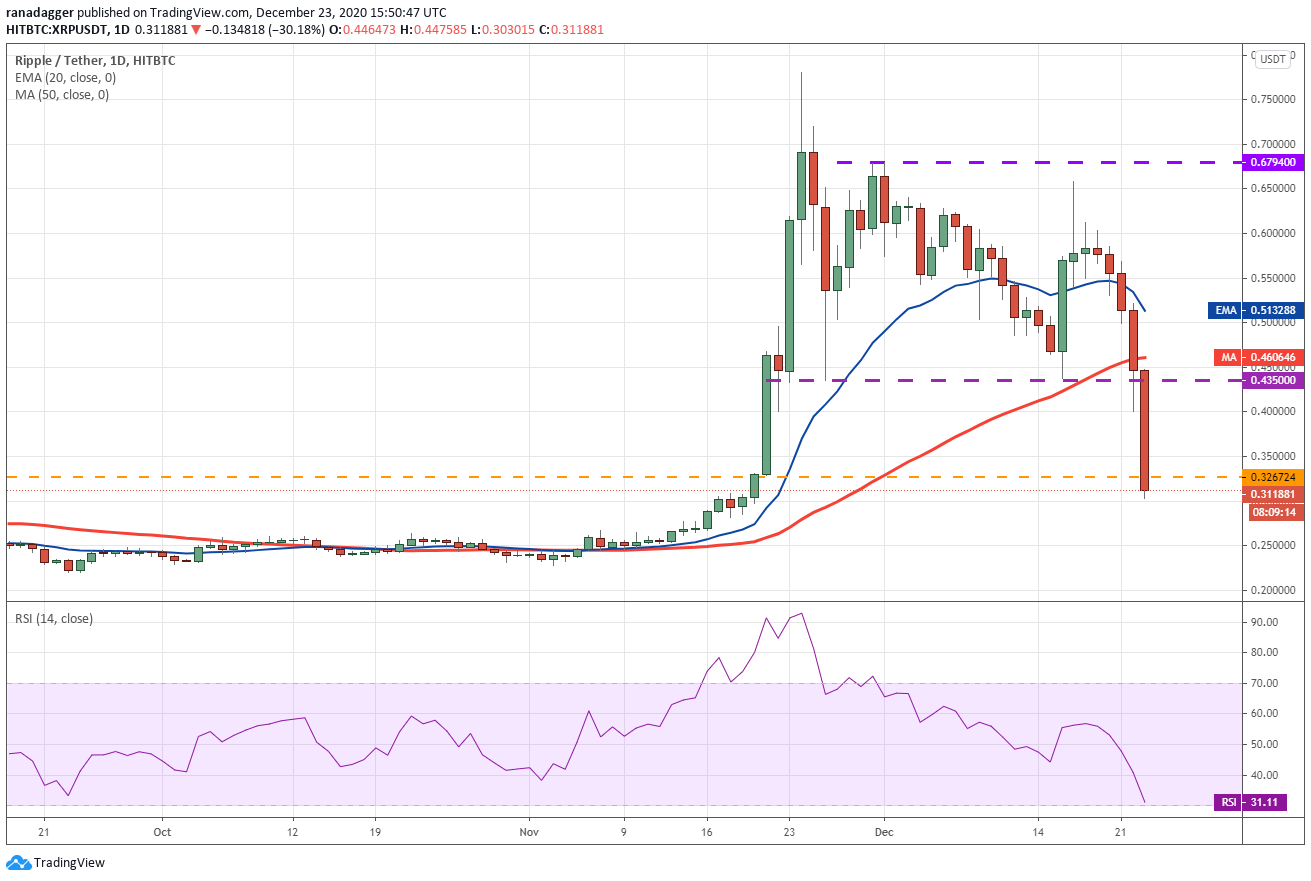
However, the 20-day EMA ($0.513) has turned down and the RSI has dropped close to the overbought territory, which suggests that the trend has turned in favor of the bears.
Even if the price rebounds off the current levels, the bears are likely to sell on relief rallies to $0.435 and then at the 20-day EMA.
If the price sustains below $0.326724, the XRP/USD pair could sink to $0.25. If that happens, the pair will complete a 100% retracement of the most recent leg of the up-move.
LTC/USD
Litecoin (LTC) rebounded off $98.40 on Dec. 22 but the bulls could not push the price above the $118.6497 resistance. This suggests that traders are using rallies to offload their positions.
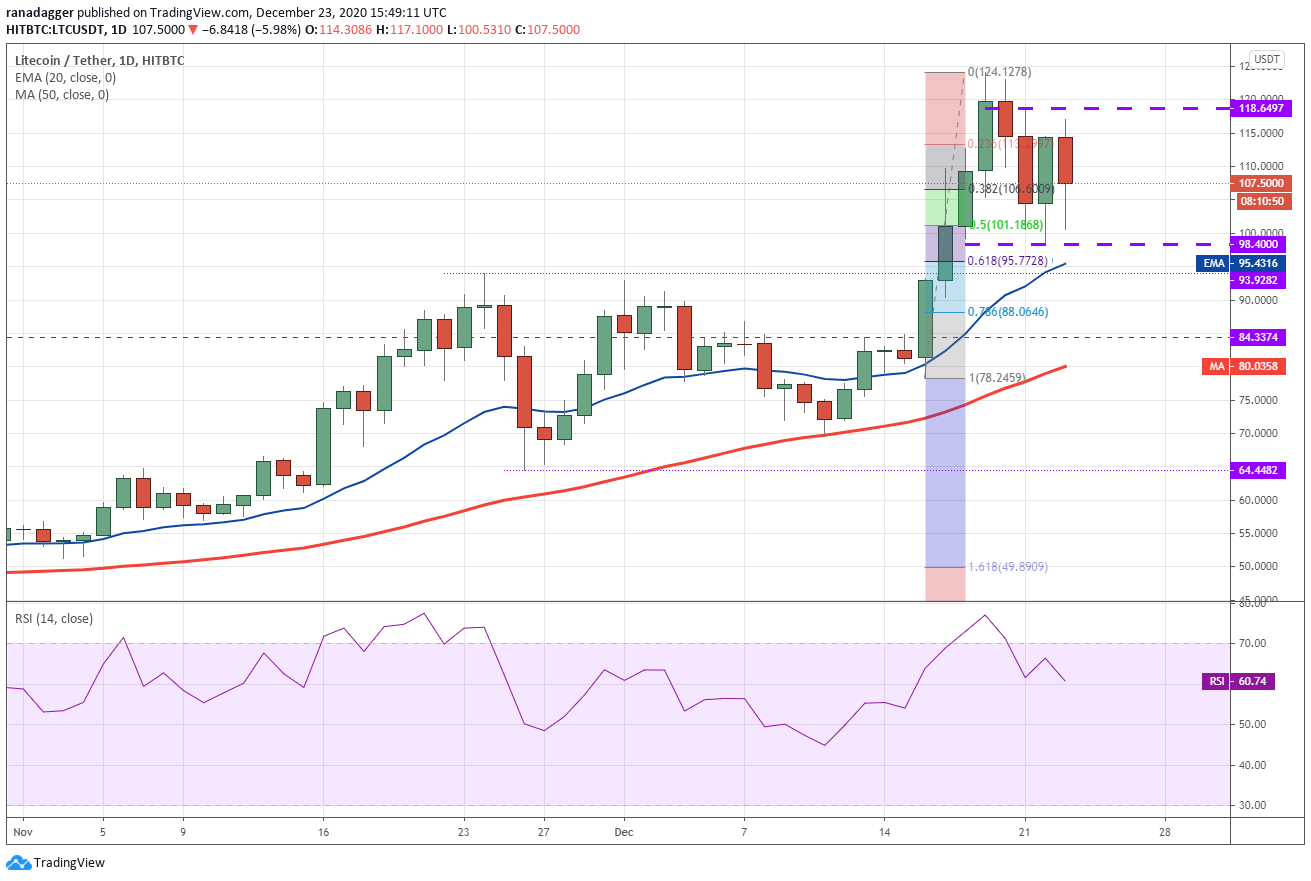
The bears will now try to sink the price below the $98.40 support and the 20-day EMA at $95. If they succeed, the LTC/USD pair could drop to the 50-day SMA ($80). Such a move will suggest a possible change in trend from bullish to range-bound.
Contrary to this assumption, if the price again rebounds off $98.40, the pair may remain stuck in a tight range for a few days.
The rising moving averages and the RSI above 60 suggest that bulls have the upper hand. A break above the $118.6497 to $124.1278 resistance zone could indicate a resumption of the uptrend that may reach $140.
BCH/USD
The long wick on Dec. 22 candlestick shows that bulls purchased the dip to the 20-day EMA ($299). However, they could not build up on the rebound and renewed selling by the bears today has pushed Bitcoin Cash (BCH) below the 20-day EMA.
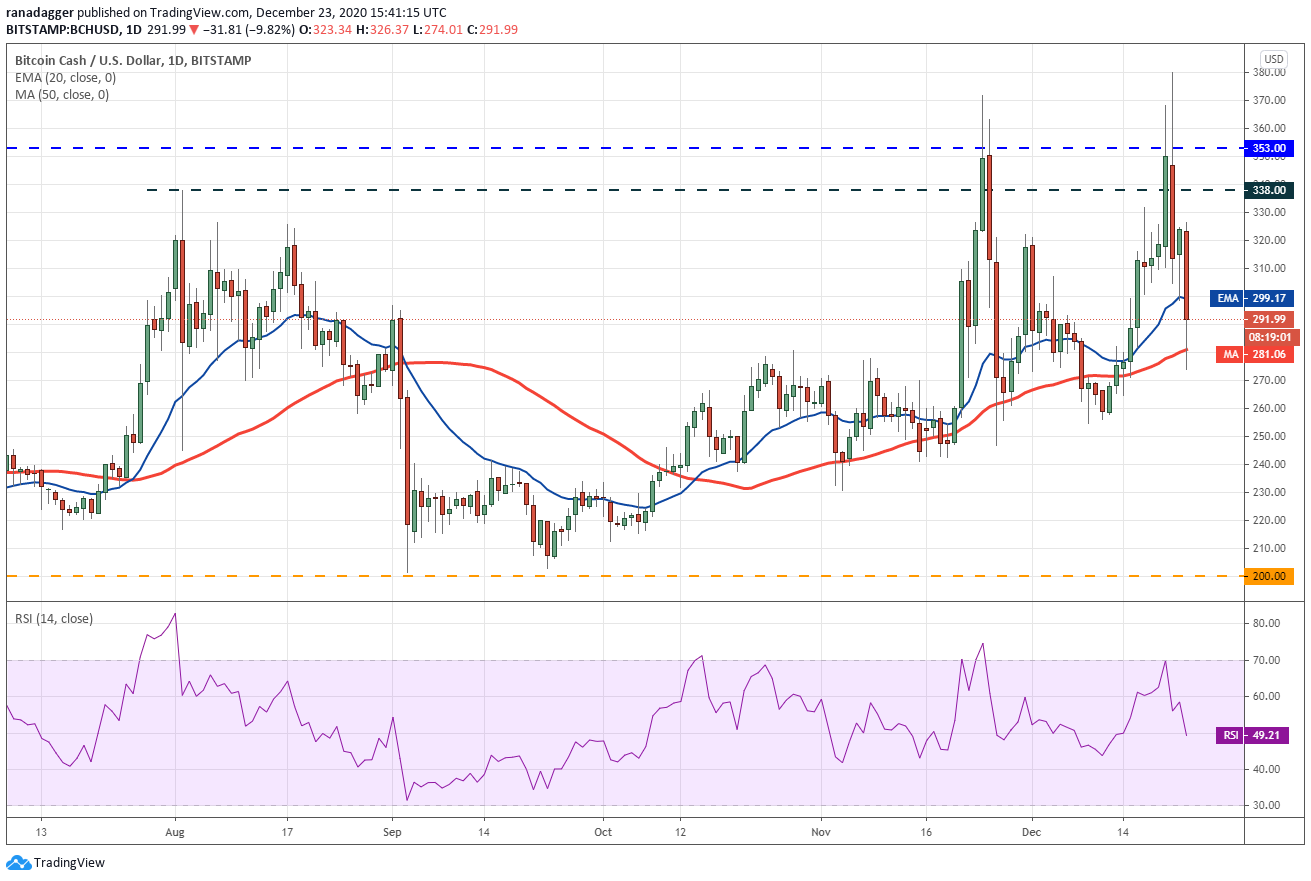
If the bears sink and sustain the price below the 50-day SMA ($281), the BCH/USD pair could drop to $250. The bulls may try to defend the zone between $230 and $250 and if they succeed, a strong rebound is likely.
However, the bears will try to stall any relief rally at the 20-day EMA. If that happens, the price may turn down and break below $230, which could result in a fall to the next critical support at $200.
LINK/USD
Chainlink (LINK) bounced off the uptrend line on Dec. 22 but the bulls could not push the price above the moving averages. This suggests that bears are attempting to defend the 20-day EMA ($12.87).
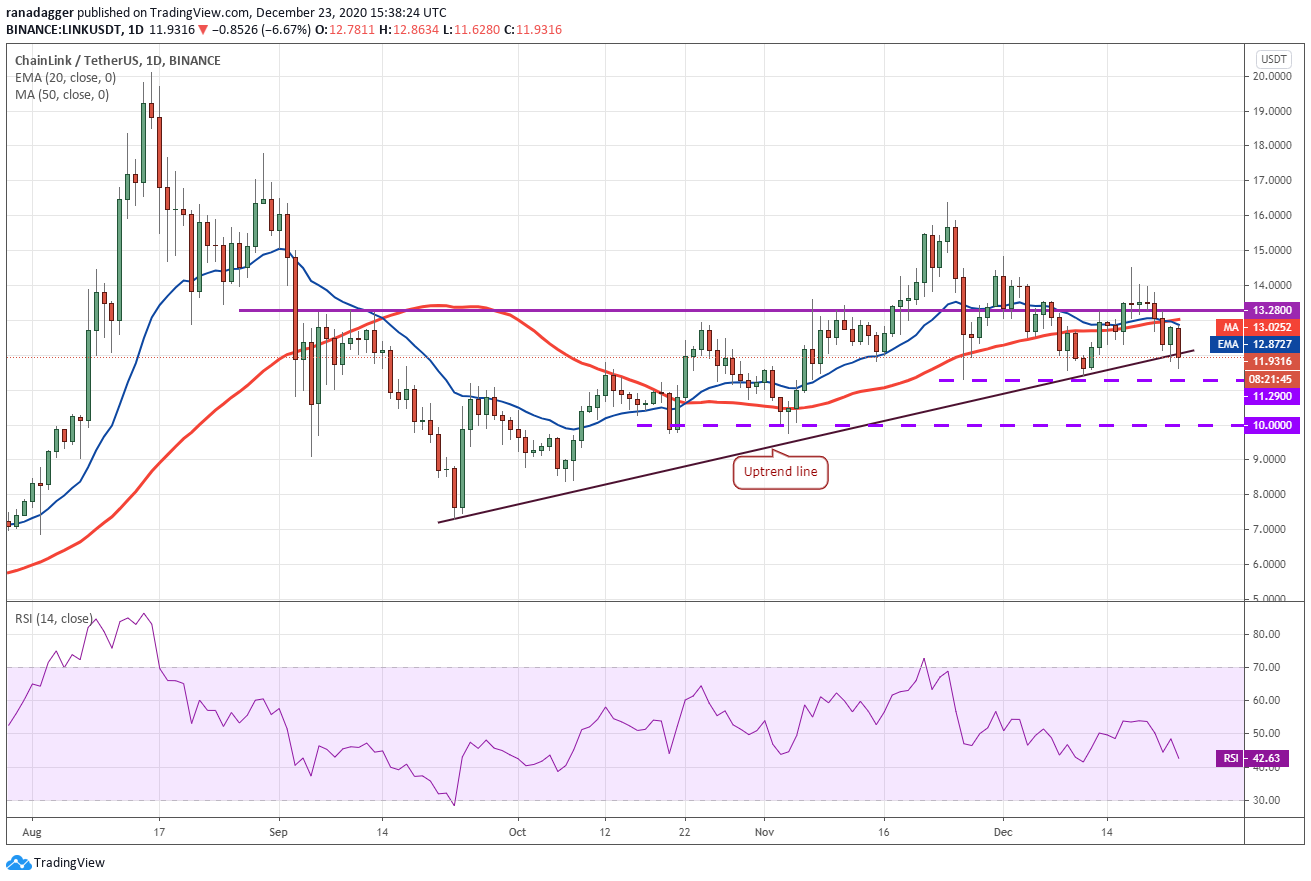
The LINK/USD pair has currently slipped below the uptrend line, which suggests a possible change in trend. There is a minor support at $11.29 but if this level cracks, the pair may drop to $10.
The RSI has dipped below 43 and the 20-day EMA has started to turn down, which suggests that the momentum is shifting in favor of the bears.
This negative view will be invalidated if the pair rebounds off the immediate support and rises above $13.28. Such a move will suggest that traders are accumulating at lower levels.
BNB/USD
Binance Coin (BNB) dipped to the 20-day EMA ($30.88) on Dec. 22 but aggressive buying at lower levels propelled the price back above $33.3888. However, the bulls could not build upon this rebound and the price had again dropped to the 20-day EMA today.
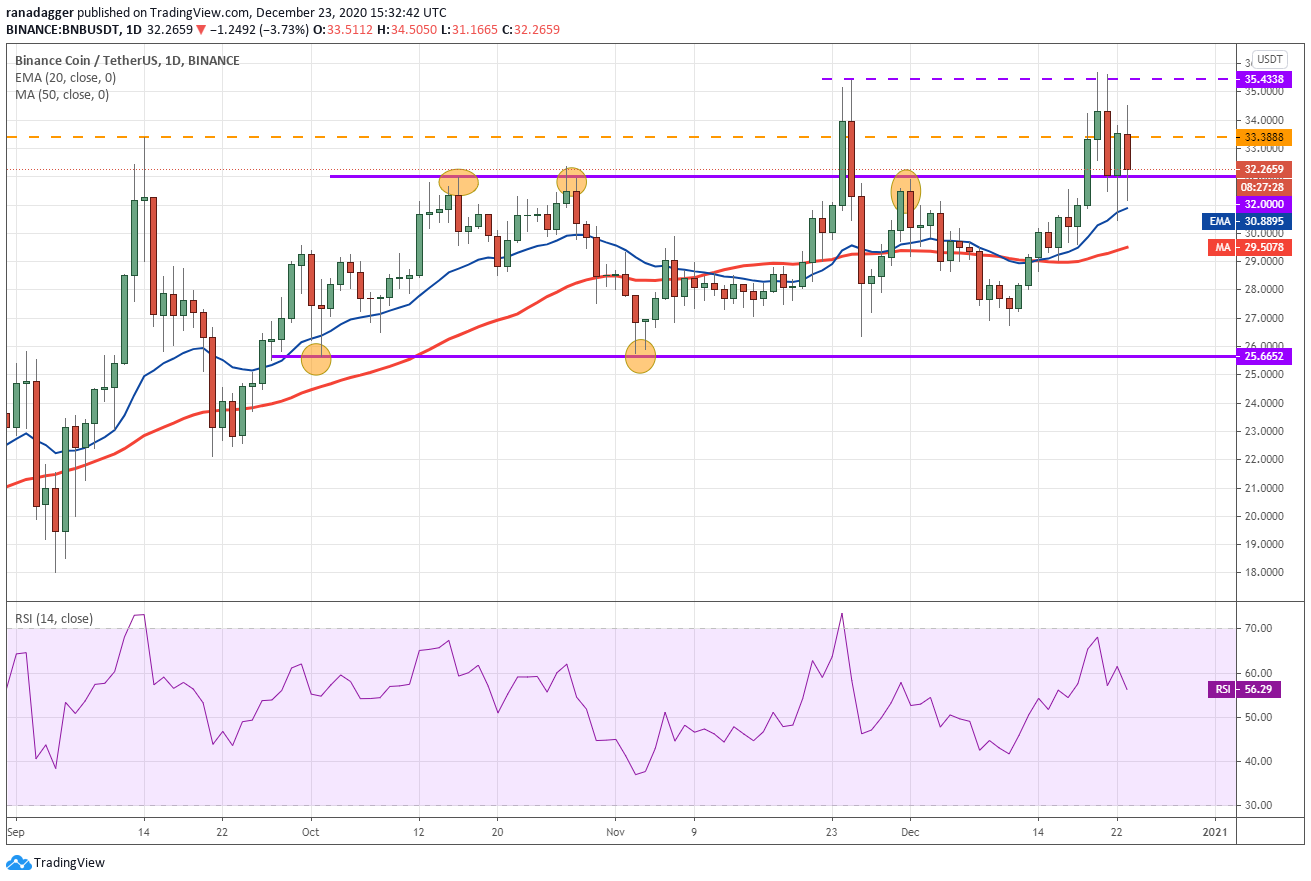
If the bulls can keep the price above $32, the BNB/USD pair could trade in a tight range between $32 and $35.4338 for a few days.
A break above $35.4338 could resume the uptrend and open the doors for a rally to the all-time high at $39.5941. The upsloping 20-day EMA and the RSI in the positive territory suggest that bulls have the upper hand.
Contrary to this assumption, if the price breaks below the 20-day EMA, the pair may drop to the 50-day SMA ($29.50) and get stuck inside the $32 to $25.6652 range.
ADA/USD
The bulls pushed Cardano (ADA) back above the 20-day EMA ($0.153) on Dec. 22 but they could not sustain the higher levels. This suggests that every minor relief rally is attracting selling by the bears.
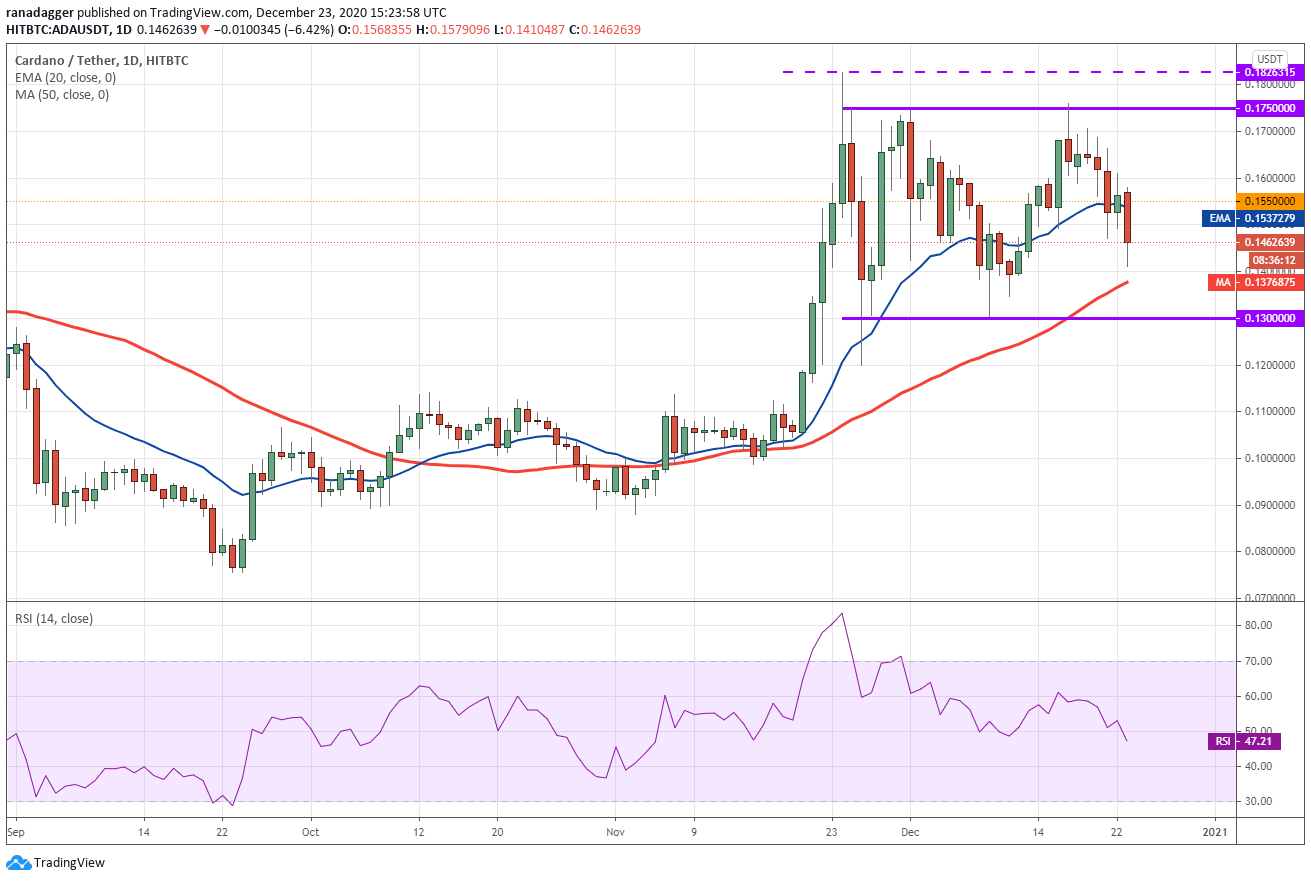
The sellers will now try to sink the price to the critical support of the range at $0.13. As bulls had purchased the dip to this support on two previous occasions, they may again try to defend the level.
If they succeed, the ADA/USD pair could extend its stay inside the $0.13 to $0.175 range for a few more days.
Contrary to this assumption, if the bears sink and sustain the price below $0.13, the trend could turn in favor of the bears, and a drop to $0.12 and then to $0.11 may be on the cards.
DOT/USD
Polkadot (DOT) rebounded off the 50-day SMA ($4.93) on Dec. 22 but the bulls have not been able to build upon the recovery, which shows traders are selling on rallies. The flat moving averages and the RSI just below the midpoint suggest a balance between supply and demand.
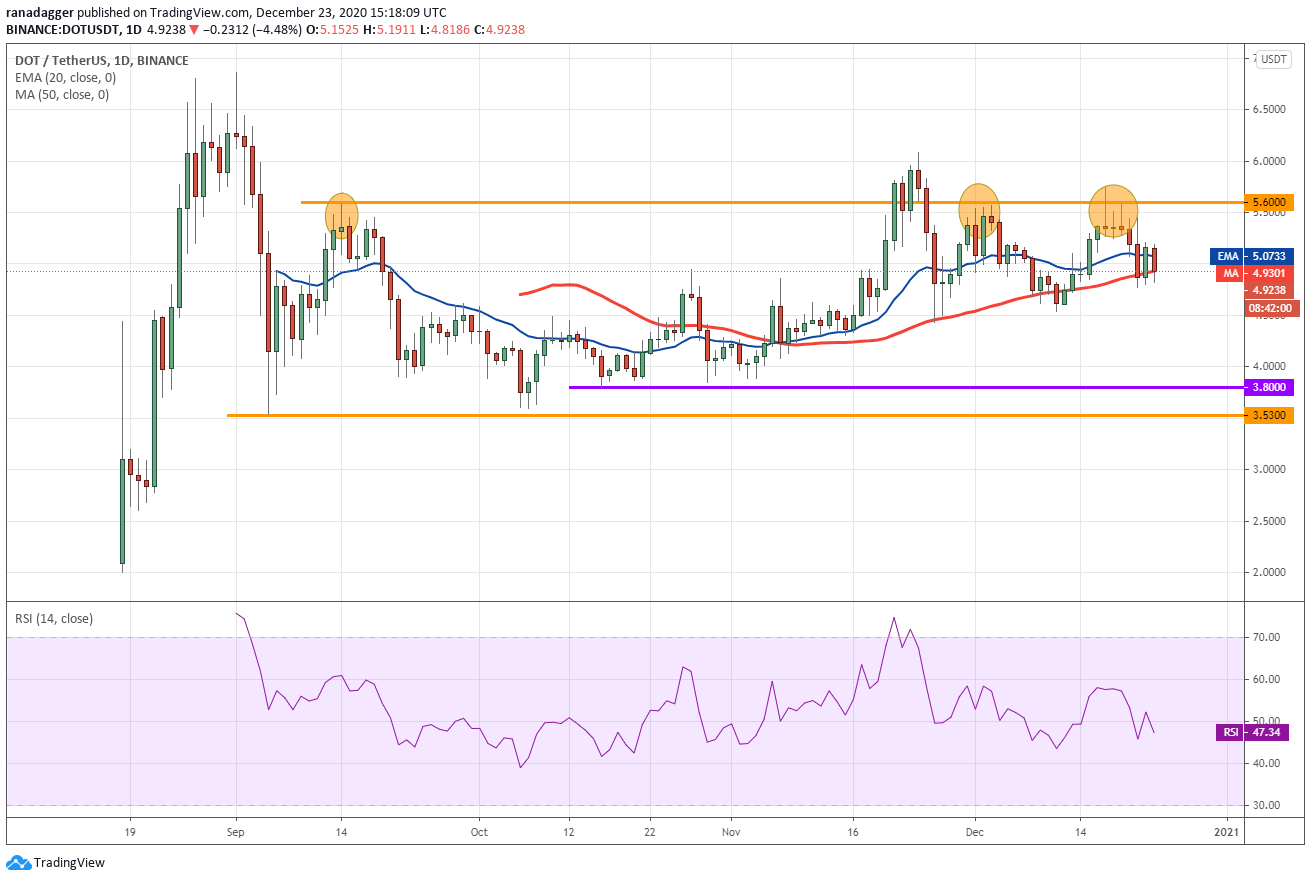
If the bears sink the price below the 50-day SMA and the $4.43 support, the DOT/USD pair could drop to the bottom half of the large $3.53 to $5.60 range.
The bulls are likely to buy the drop to the $3.80 to $3.53 support zone and a strong bounce off it could keep the pair range-bound for a few more days.
On the contrary, if the price turns up from the current levels and rises above $5.60, a new uptrend could start. There is a minor resistance at $6.0857. But if this level is crossed, the up-move may reach $6.8619.
XLM/USD
Stellar Lumens (XLM) broke below the 20-day EMA ($0.166) on Dec. 21 and the 50-day SMA ($0.14) today. However, the long tail on today’s candlestick shows that bulls are buying aggressively at lower levels.
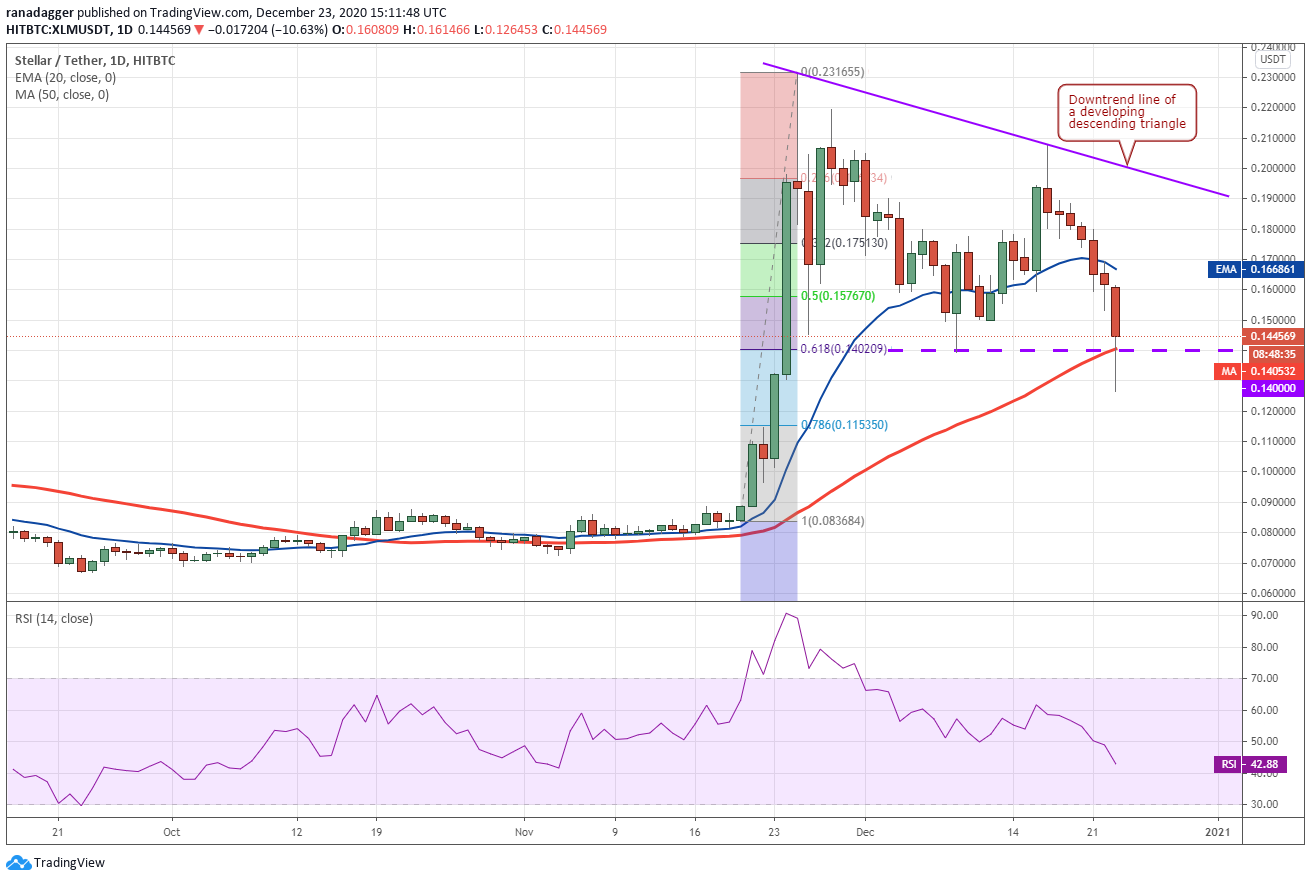
If the price rebounds off $0.14, the XLM/USD pair may move up to the 20-day EMA where it is likely to face resistance. The 20-day EMA has started to turn down and the RSI has dropped into the negative zone indicating advantage to the bears.
If the pair dips and sustains below $0.14, it will complete a descending triangle pattern that could intensify selling and pull the price down to the 78.6% Fibonacci retracement at $0.11535 and then to $0.083684.
This negative view will be invalidated if the bulls can push the price above the 20-day EMA and the downtrend line.
The views and opinions expressed here are solely those of the author and do not necessarily reflect the views of Cointelegraph. Every investment and trading move involves risk. You should conduct your own research when making a decision.
Market data is provided by HitBTC exchange.