

While Bitcoin price action remains lackluster, altcoins are attempting to make a strong upside move.
Although Bitcoin (BTC) is not showing any trending move, Bakkt and the Chicago Mercantile Exchange (CME) Group continue to roll out products designed to attract the large traders. Bakkt recently announced that it will add a cash-settled futures contract to its existing Bitcoin-settled contract. On the other hand, the CME group plans to offer options on Bitcoin futures after receiving the necessary regulatory approvals.
Bitfinex cryptocurrency exchange is also planning to launch a slew of products, which include, options trading and a gold-backed stablecoin, to attract customers. These actions by cryptocurrency exchanges instill confidence that trading volume is likely to pick up. These products will also limit the possibility of market manipulations by the whales.

Daily cryptocurrency market performance. Source: Coin360
Venture capitalist Tim Draper continues to be bullish on Bitcoin and has reiterated his previous price prediction of $250,000 by 2022 or 2023. He expects the “Lightning Network and OpenNode and maybe others” to facilitate the use of Bitcoin for micropayments, which will boost the price.
Swiss crypto broker Bitcoin Suisse has also announced plans to team up with payment and transaction services provider Worldline to increase the use of crypto in the country. Such initiatives will help speed up the integration of cryptocurrencies in the economy.
While the fundamentals continue to improve, do the technicals also indicate the possibility of an up move? Let’s analyze the charts and find out.
BTC/USD
The pullback after the sharp rally in late October is finding buyers close to the 61.8% Fibonacci retracement levels of the up move. This shows that the bulls are initiating long positions on dips. If Bitcoin can rise above the 20-day EMA and the downtrend line, it will indicate strength.
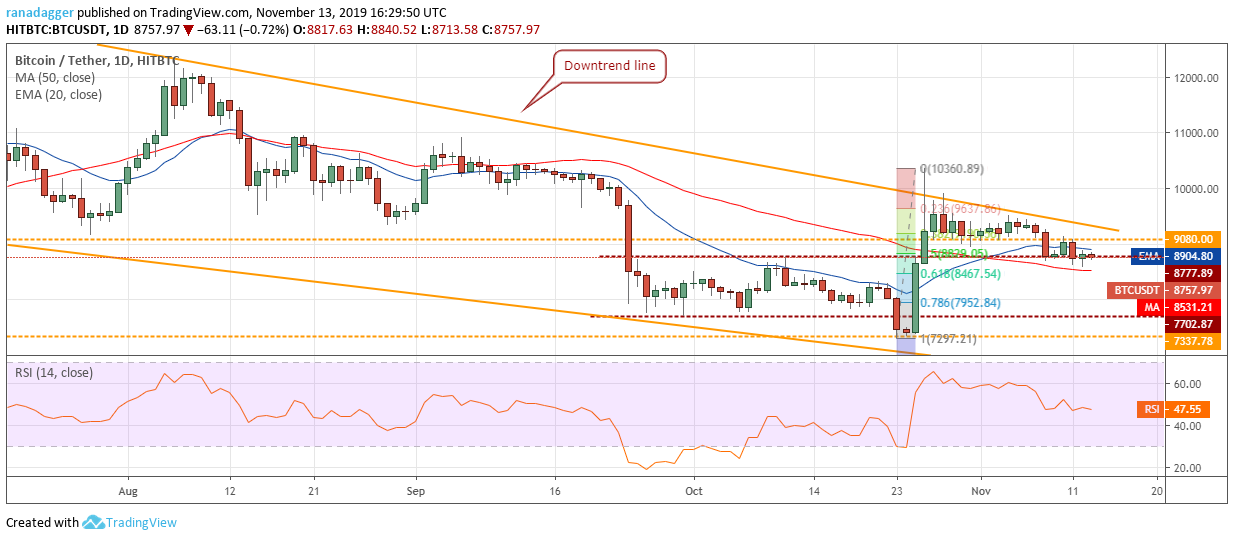
There is a stiff resistance close to $9,600. A strong breakout of this level can carry the price to $10,360 and above it to $12,000. Traders can buy on a breakout and close (UTC time) above the downtrend line and keep a stop loss just below the recent lows.
Contrary to our assumption, if the BTC/USD pair fails to pick up momentum above the downtrend line, it might remain range-bound for a few days. The flattish moving averages and RSI just below the midpoint suggests a consolidation for a few days.
The trend will turn negative if the bears sink the price below $8,467.54. If this level cracks, a fall to $7,952.84, which is 78.6% Fibonacci retracement level of the most recent rally is possible.
ETH/USD
Ether (ETH) continues to consolidate in the upper half of the $197.75 to $161.056 range. The bunching of the price action close to the resistance of the range is a positive sign. It indicates that the bulls are supporting the altcoin at higher levels and are not waiting for a dip to buy.
If the price breaks out of $197.75, the altcoin is likely to pick up momentum and quickly move up to $235.70. Therefore, traders can hold their long positions with stops at $150.
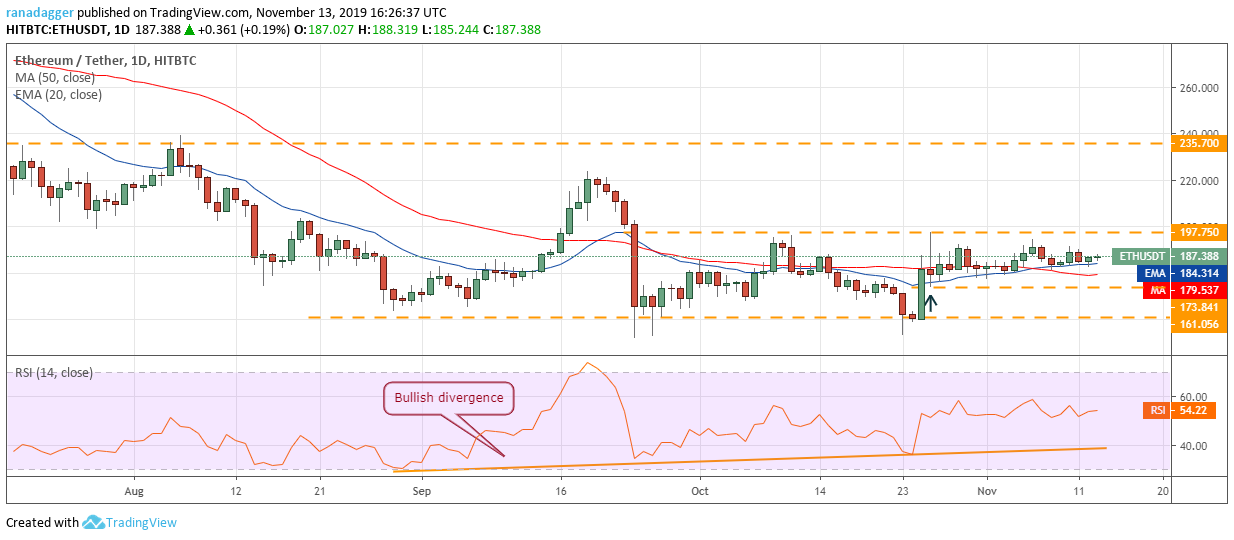
Contrary to our assumption, if the bulls fail to scale and sustain above $197.75, the bears will attempt to sink the ETH/USD pair below the moving averages. The support levels to watch on the downside are $173.841 and below it $161.056. A break below this support will resume the downtrend. However, we give it a low probability of occurring.
XRP/USD
XRP has been trading below the 50-day SMA for the past two days but the bears are struggling to sink it to the next support at $0.24508. This indicates some buying by the aggressive bulls close to the current levels. However, until the buyers push the price above the 20-day EMA, the altcoin remains weak.
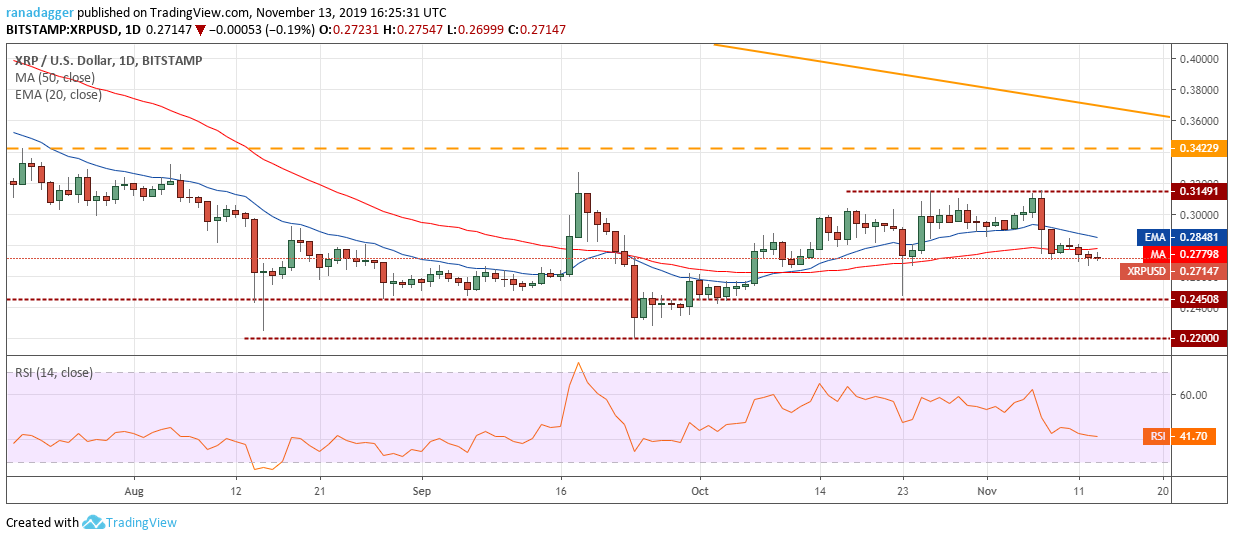
The 20-day EMA has turned down and the RSI is in the negative zone, which suggests that bears have the upper hand. A failure to rise above the moving averages can start the next wave of selling that can drag the XRP/USD pair to $0.24508. If this support also cracks, a drop to $0.22 is possible. Therefore, traders can retain the stop loss on the long positions at $0.24.
BCH/USD
Bitcoin Cash (BCH) has been consolidating between $306.78 and $269.10 for the past few days. The 20-day EMA is sloping up and the RSI is just above the midpoint, which suggests that bulls have a slight advantage.
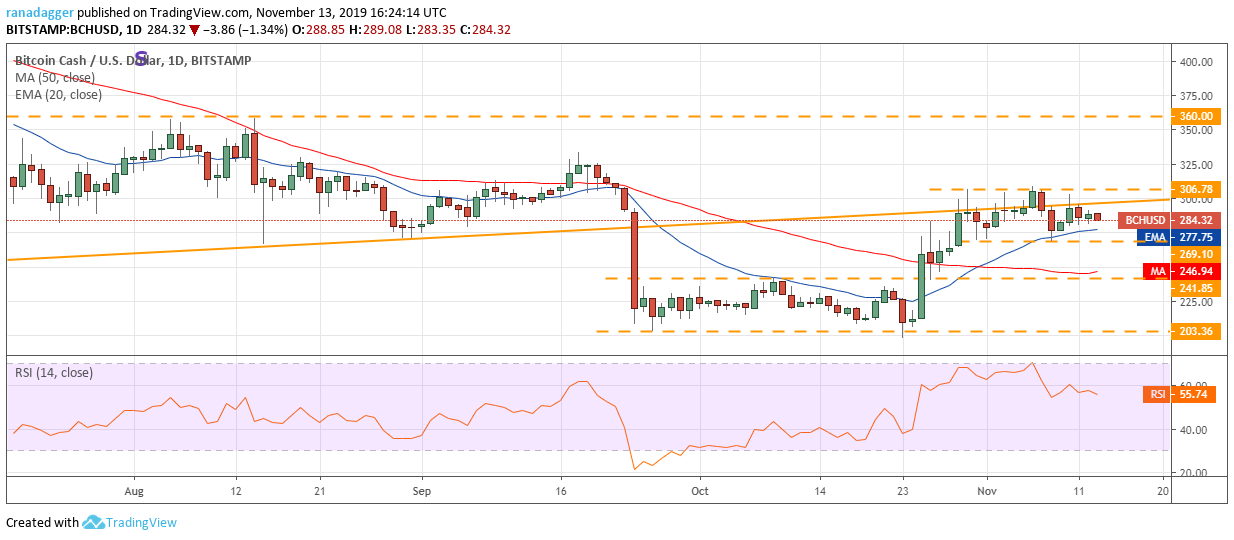
If the bulls push the price above $306.78, a rally to $360 is possible. Conversely, if the bears sink the BCH/USD pair below the 20-day EMA, it will retest the support at $269.10. If this support also cracks, a drop to $241.85 is likely. Hence, traders can retain the stop loss on the long positions at $267.
LTC/USD
Litecoin (LTC) has again corrected to the 20-day EMA. Repeated retest of a support level weakens it. Therefore, we anticipate the support to give way and the price to dip to the 50-day SMA. This is an important support to watch out for because if it breaks down, a drop to $50 is possible.
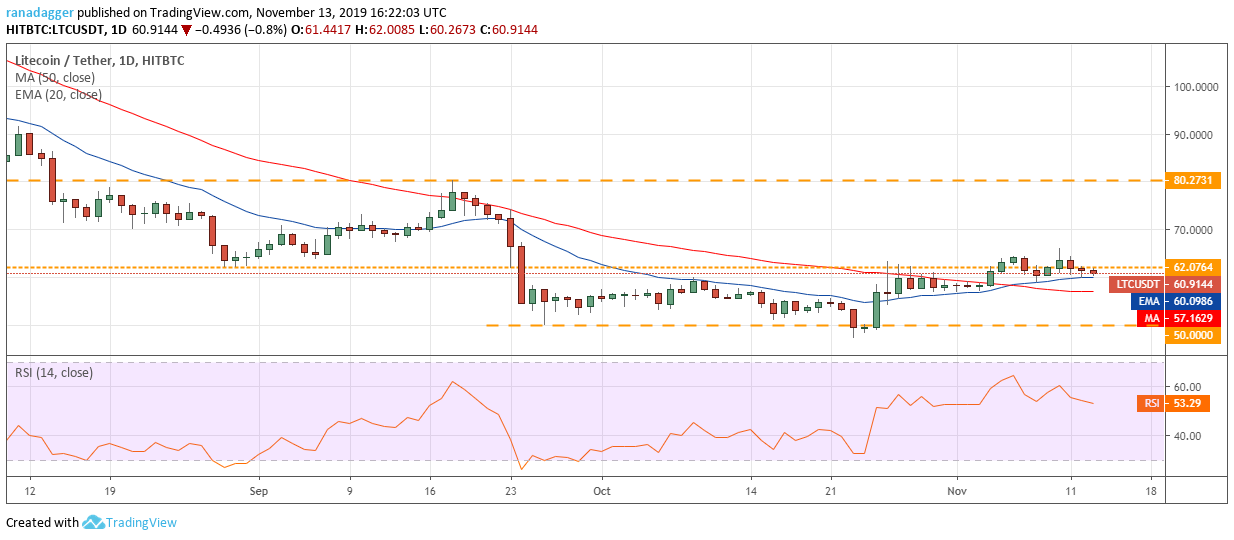
Contrary to our assumption, if the LTC/USD pair bounces off the moving averages, the bulls will try to carry it above the overhead resistance of $66.1486. If successful, a move to $80.2731 is likely. For now, the traders can retain the stop loss on the long positions at $47.
EOS/USD
EOS has been trading between $3.37 and $3.69 since Nov. 5. Both moving averages are flattening out and the RSI is just above the midpoint. This shows a balance between demand and supply.
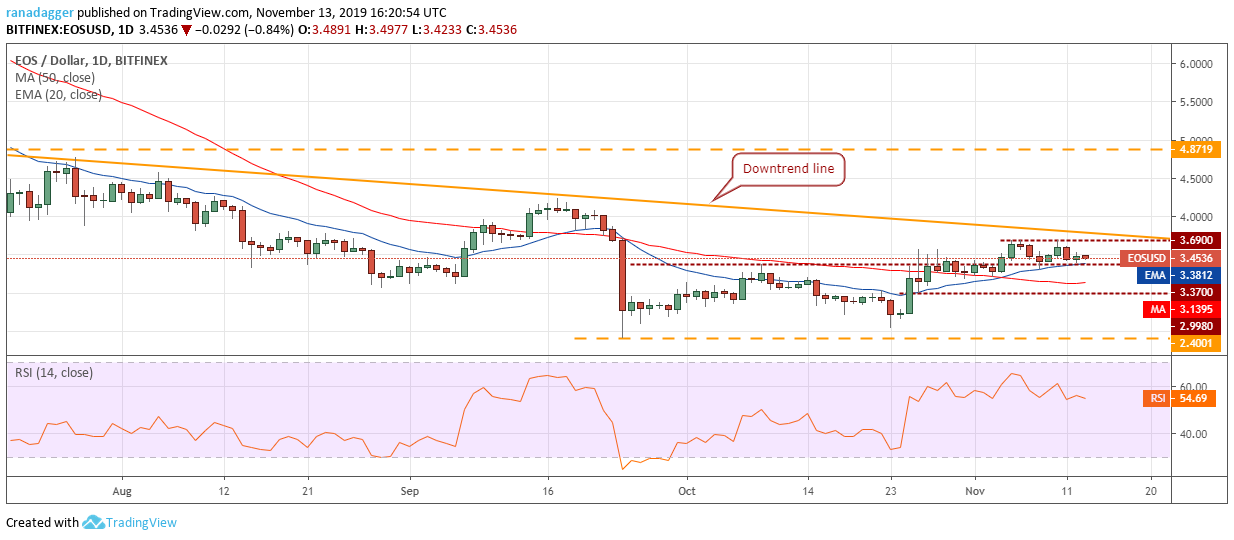
If the bulls can push the price above $3.69, the EOS/USD pair can move up to $4.24 and above it to $4.8719. Alternatively, if the price breaks down of $3.37, a drop to $2.998 is possible. If this level also fails to provide support, the decline can extend to $2.4001. Therefore, traders can keep the stop loss on the long positions at $2.95.
BNB/USD
The bulls are attempting to propel Binance Coin (BNB) above the overhead resistance of $21.2378. If the price sustains above $21.2378, it will resume the new uptrend that can carry it to $23.5213 and above it to $30. The rising moving averages and the RSI in positive zone indicates that the bulls are in command.

Our bullish view will be negated if the BNB/USD pair fails to sustain above $21.2378. If the price turns around and plummets below the 20-day EMA and the 50-day SMA, it will indicate a lack of buyers at higher levels. Traders can retain a stop loss on the long positions at $16. We will suggest trailing it to $17.5 if the price sustains above $21.2378.
BSV/USD
After a doji candlestick pattern on Nov. 12, Bitcoin SV (BSV) dipped below the 20-day EMA today. However, the bears are struggling to keep the price down. Buying at lower levels has pushed the price back above the 20-day EMA, which shows that bulls are active at lower levels.
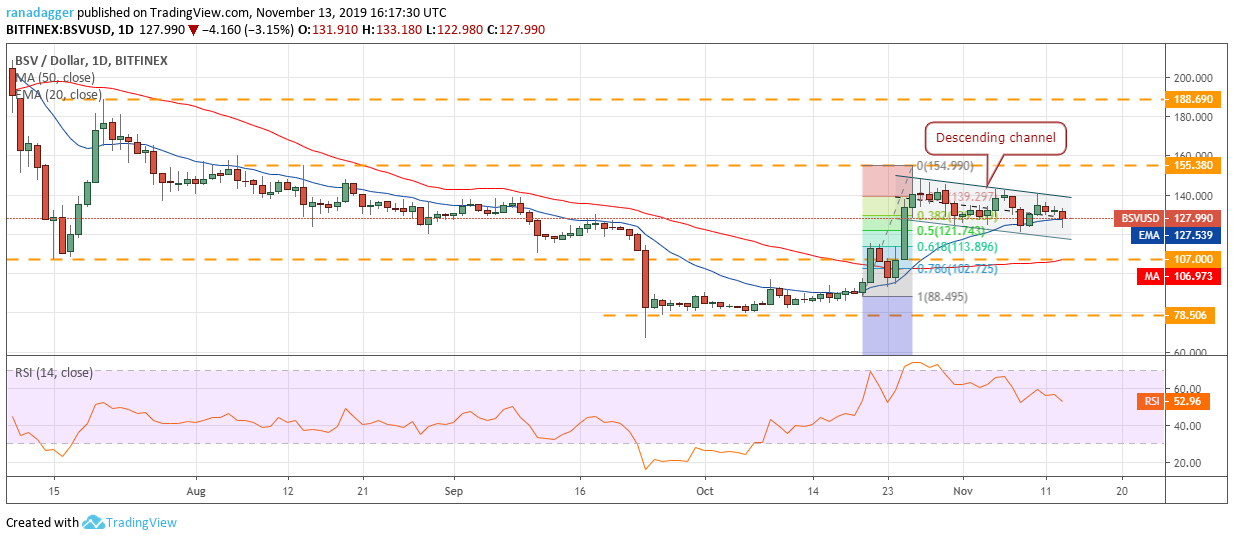
If buyers can propel the BSV/USD pair above the descending channel, the uptrend is likely to resume. There is resistance at $155.38, above which the up move can reach $188.69.
Conversely, if the pair sustains below the 20-day EMA, it can drop to the support line of the channel and below it to the 50-day SMA. We will wait for the price to sustain above the channel before recommending a trade in it.
XLM/USD
Stellar (XLM) is facing resistance above $0.080 level and is witnessing buying close to the 20-day EMA. This shows that bulls are buying on dips but are cashing out after a small rally. This tightening of the range will eventually result in a sharp move in either direction. The upsloping 20-day EMA shows that the bulls have the upper hand and a breakout of the downtrend line is likely.

A breakout and close (UTC time) above the downtrend line will be the first indication that the up move is resuming. There is a stiff resistance at $0.088708, above which, the XLM/USD pair could move up to $0.145. We remain bullish but will wait for a close (UTC time) above the downtrend line to suggest any trade in it.
Contrary to our assumption, if the pair turns down from the downtrend line and slides below the 20-day EMA, it can drop to the 50-day SMA.
TRX/USD
The bulls have defended the 20-day EMA, which is a positive sign. If they can push Tron (TRX) above $0.0204880, a rally to $0.0234 and above it to $0.0276185 is possible. The momentum can even extend the up move to $0.030.
As the risk to reward ratio is attractive, traders can buy if the price sustains above $0.0204880 for about four hours. The initial stop loss can be placed at $0.018.

Both moving averages have started to turn up once again and the RSI has risen into the positive territory, which shows that bulls have the upper hand. Our bullish view will be invalidated if the TRX/USD pair turns down from $0.0204880 and plummets below $0.018660.
The views and opinions expressed here are solely those of the author and do not necessarily reflect the views of Cointelegraph. Every investment and trading move involves risk. You should conduct your own research when making a decision.
Market data is provided by HitBTC exchange.


