

This dip is a good buying opportunity in Bitcoin. What are the critical levels to watch out for? Let’s look at the charts.
The views and opinions expressed here are solely those of the author and do not necessarily reflect the views of Cointelegraph. Every investment and trading move involves risk, you should conduct your own research when making a decision.
Market data is provided by the HitBTC exchange.
Bitcoin rallied from $3,355 on Jan. 29 to a high of $13,973.5 on June 26. That is a gain of 316.49% in just under five months. In that, the last 56% of the rally happened after Facebook unveiled Libra. In the past few days, Libra has come under increased scrutiny from regulators and politicians and Bitcoin has given back the last leg of the gains.
While Libra might dent sentiment in the short term, it is unlikely to change the long-term trend in Bitcoin that is buoyed by fundamentals. Digital asset management fund Grayscale Investments has reported a significant growth in its assets under management, which has hit an all-time high of $2.7 billion with huge participation from institutional players. Similarly, Bitcoin’s average transaction volume has jumped from $1.04 billion on April 17 to $3.22 billion on July 16, according to crypto analytics site Coinmetrics.io.
We believe that the current correction is a good entry point because soon the crypto markets will turn their focus on the launch of Bakkt, the increasing interest shown by institutional investors and Bitcoin halving due next year. However, instead of buying in a downtrend, we suggest traders wait for a bottom to be signaled before jumping in.
BTC/USD
Bitcoin (BTC) broke below the 50-day SMA on July 16 for the first time since February 17 of this year. Though this is a negative sign, we will watch whether the selling intensity picks up or whether the price reverses direction and quickly rises back above the 50-day SMA.
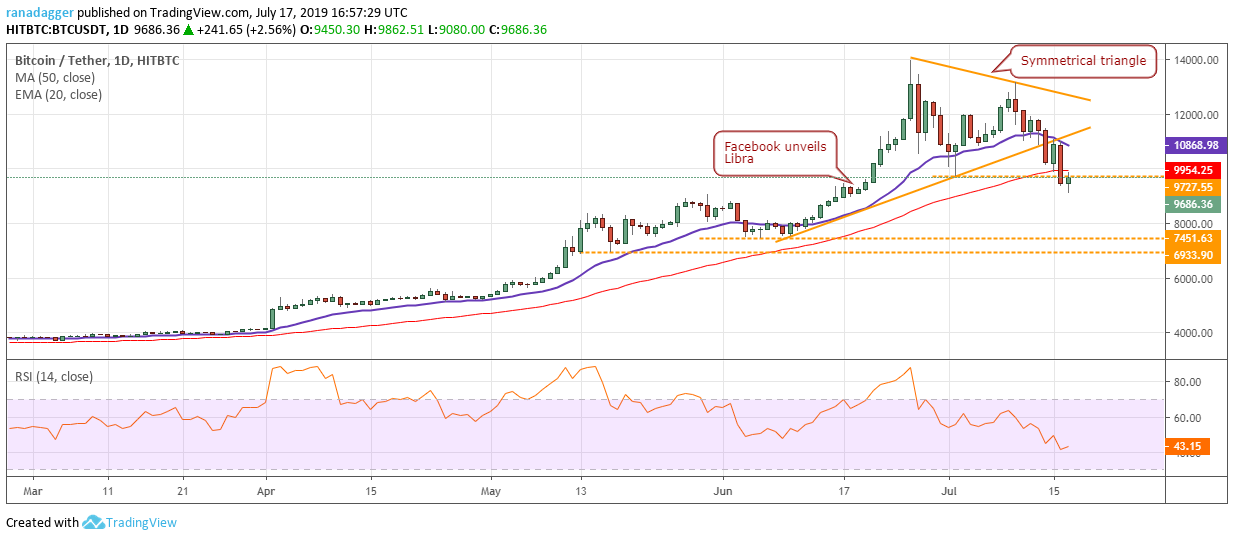
If the BTC/USD pair climbs back above the 50-day SMA and sustains, it will indicate buying support at lower levels. The pair will gain strength on a breakout above the 20-day EMA. While the 20-day EMA has started to turn down, the 50-day SMA is still sloping up, which suggests that the medium-term trend is bullish. Therefore, we are on the lookout to buy if we spot a reversal pattern on the pair.
Contrary to our assumption, if the price fails to find buyers and continues its decline, it can dive to the $7,451.63–$6,933.90 support zone. However, we give this a low probability of occurring.
ETH/USD
The rebound off the uptrend line did not find buyers above $235.70 on July 15 and 16, hence, Ether (ETH) again dipped back to the uptrend line. The moving averages have completed a bearish crossover and the RSI is close to the oversold zone, which suggests that bears are back in the game. If the uptrend line breaks down, the next stop is at $150.
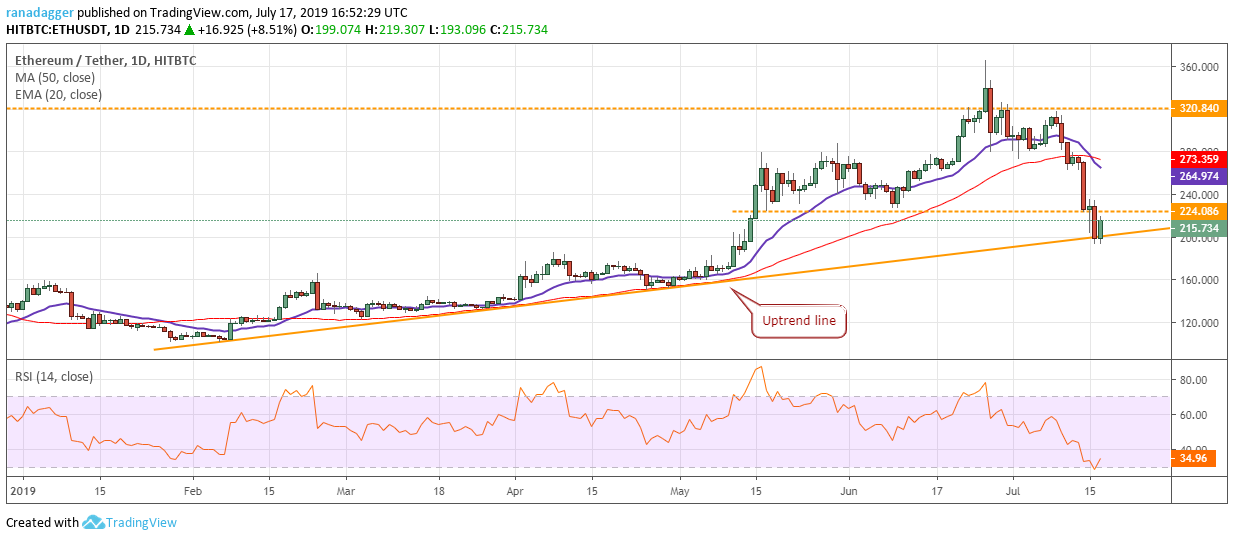
However, if the current rebound off the uptrend line breaks out of $235.70, the ETH/USD pair can rally to the 20-day EMA, which will offer stiff resistance. If the next dip sustains above $224.086, the pair might enter a range-bound action. We will wait for the buyers to assert their supremacy before proposing a trade in it.
XRP/USD
Ripple (XRP) is attempting to bounce off the critical support at $0.27795. This support has held on four previous occasions since mid-December last year, hence, we anticipate a strong defense once again. However, both the moving averages are turning down and the RSI is close to oversold levels. This suggests that the bears are in command.
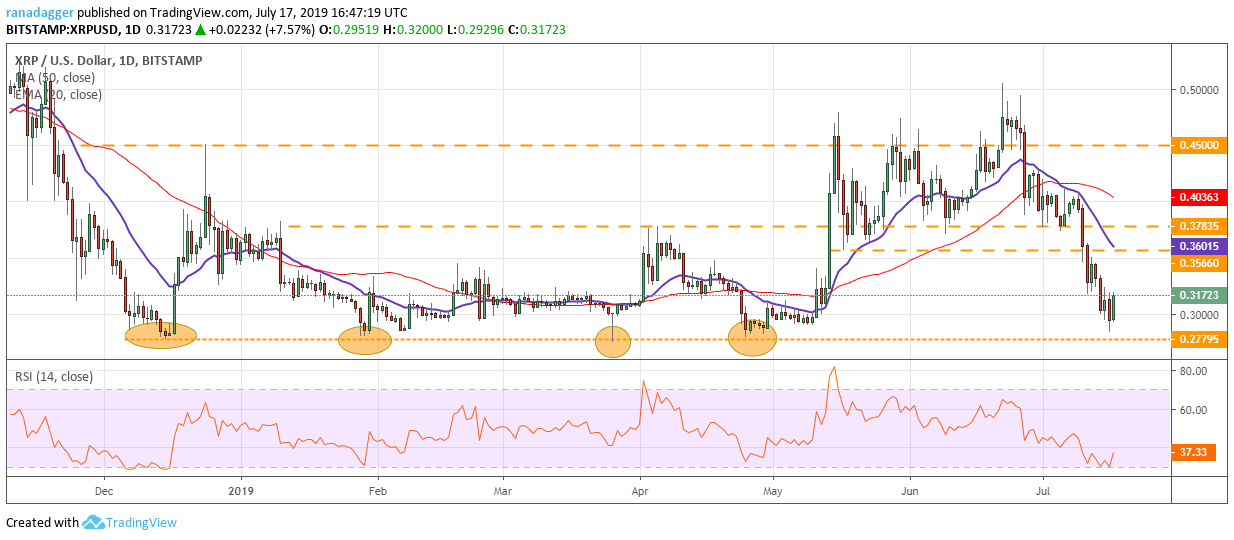
If the price slips below $0.27795, it can drop to the yearly low of $0.24508. A breakdown to new yearly lows will be very negative for the XRP/USD pair. Conversely, if the current rebound sustains, it can move up to 20-day EMA, which is likely to act as a stiff resistance. If the next dip holds above $0.27795, we might suggest a strategy to trade it.
LTC/USD
Litecoin (LTC) broke down of the critical support of $83.65 on July 16. However, the bears could not take advantage of the breakdown, as prices are staging a smart recovery today. The price has risen back above $83.65 and is likely to retest the breakdown level of the channel.
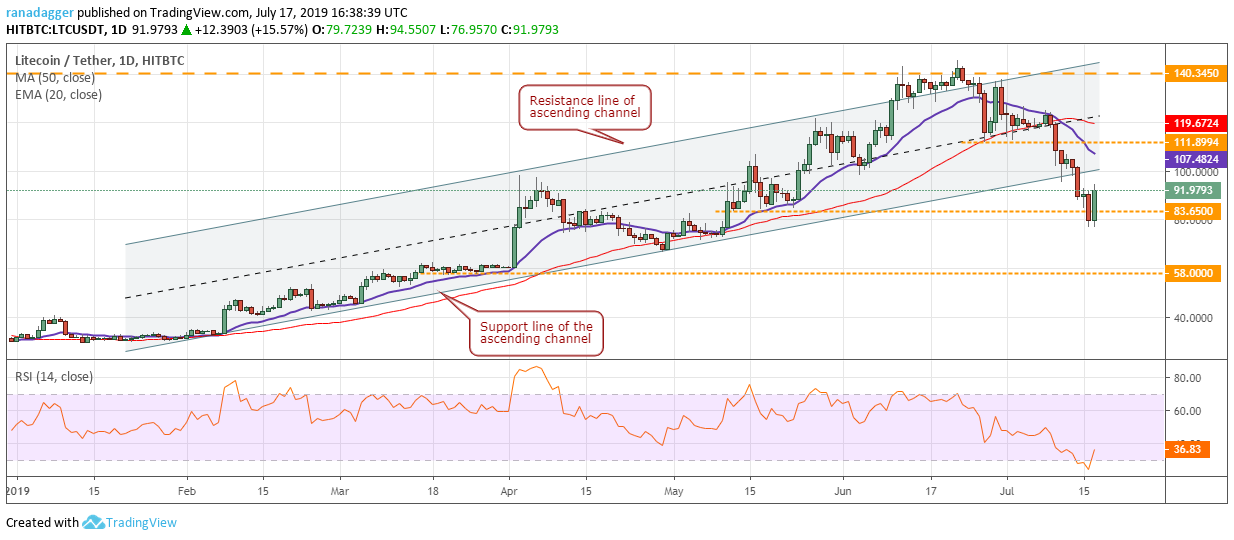
The 20-day EMA is sloping down and the RSI is close to the oversold zone, which indicates that bears are in command. Therefore, we anticipate a stiff resistance at the 20-day EMA. If the price turns down from the 20-day EMA and breaks below $76, the decline can extend to $66.47. On the other hand, if the bulls push the price inside the ascending channel and sustain it, the LTC/USD pair can rise to $120 and above it to $140.345. We shall wait for the price to confirm a bottom before suggesting a trade in it.
BCH/USD
Bitcoin Cash (BCH) is in a downtrend and is trading in the bottom half of the descending channel. The 20-day EMA is sloping down and the RSI is close to the oversold zone, which shows that bears have the upper hand. The previous recovery attempt fizzled out at $325.75 on July 15.
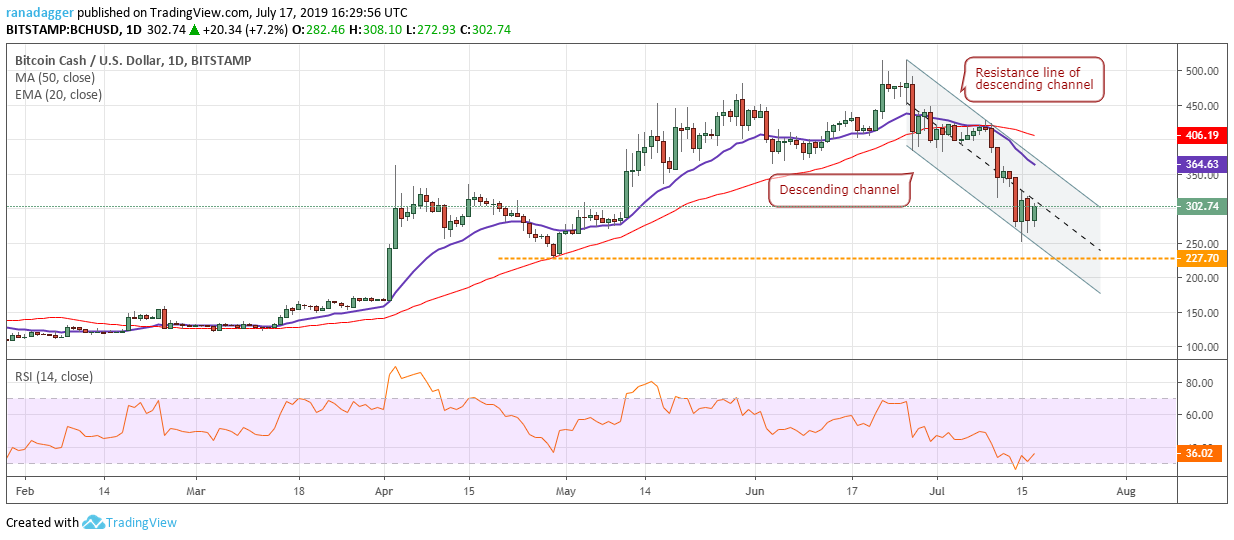
However, bulls held the support line of the descending channel on July 16 and are currently attempting to push the price back above $325.75 once again. If successful, a rally to the 20-day EMA is possible. A breakout of the channel will signal a probable change in trend. However, if the current recovery attempt fails, the BCH/USD pair can slide to $227.70 and below it to $166.98.
EOS/USD
EOS broke down of the critical support of $3.8723 on July 16. Both the moving averages are sloping down and the RSI is in oversold territory, which suggests that bears are firmly in the driver’s seat. It has a minor support at $3, below which the drop can extend to $2.20.
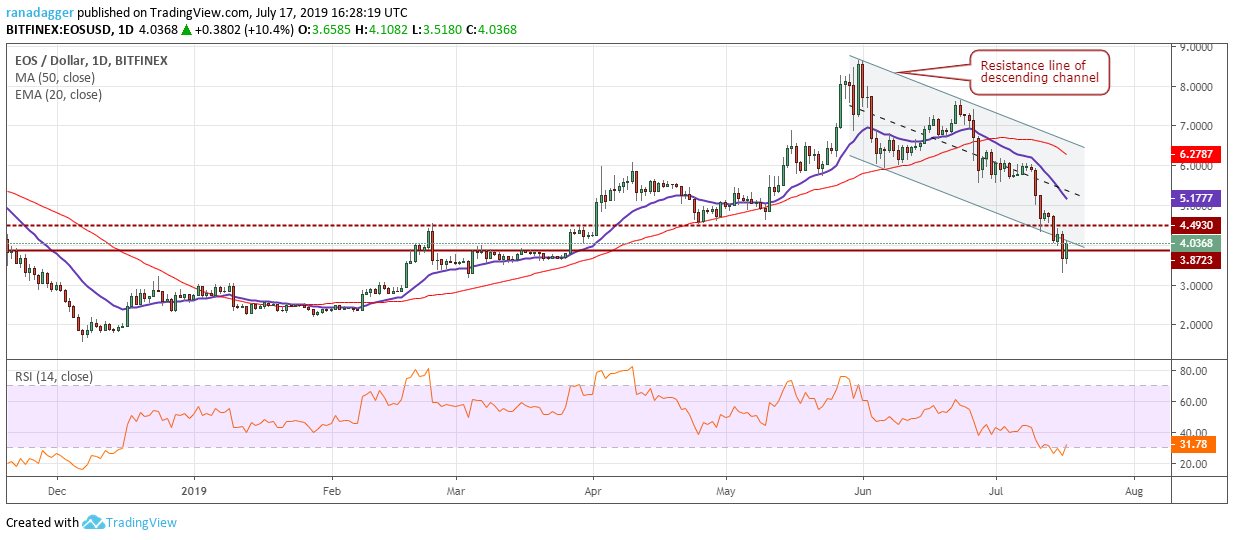
Any relief rally will now face selling in the $3.8723–$4.493 resistance zone and above it at the 20-day EMA. The first positive sign will be if the EOS/USD pair breaks out and sustains above $4.493. We will wait for the pair to stop falling and form a bullish reversal pattern before recommending a trade in it.
BNB/USD
The bulls are trying to keep Binance Coin (BNB) inside the descending channel because if the price breaks down and closes (UTC time frame) below the support line of the channel, it can drop to the next support at $18.30.
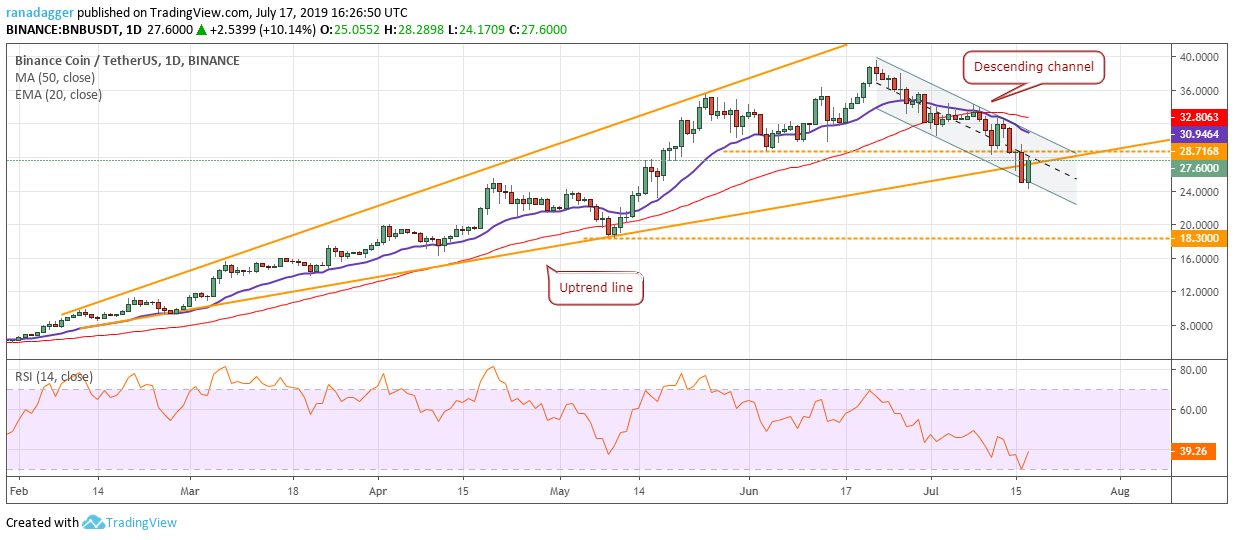
Currently, the BNB/USD pair has bounced sharply from the support line of the channel. The buyers will attempt to propel the price back above the uptrend line, which will be a positive sign. If the price can sustain above the uptrend line, it will invalidate the current breakdown. The pair is the strongest major altcoin, hence, we might suggest long positions on a breakout of the descending channel.
BSV/USD
Bitcoin SV (BSV) could not re-enter the channel on July 16 and the price turned around and resumed the down move. There is a minor support at $107, below which the fall can reach $93.680, which is the 78.6% Fibonacci retracement of the rally.
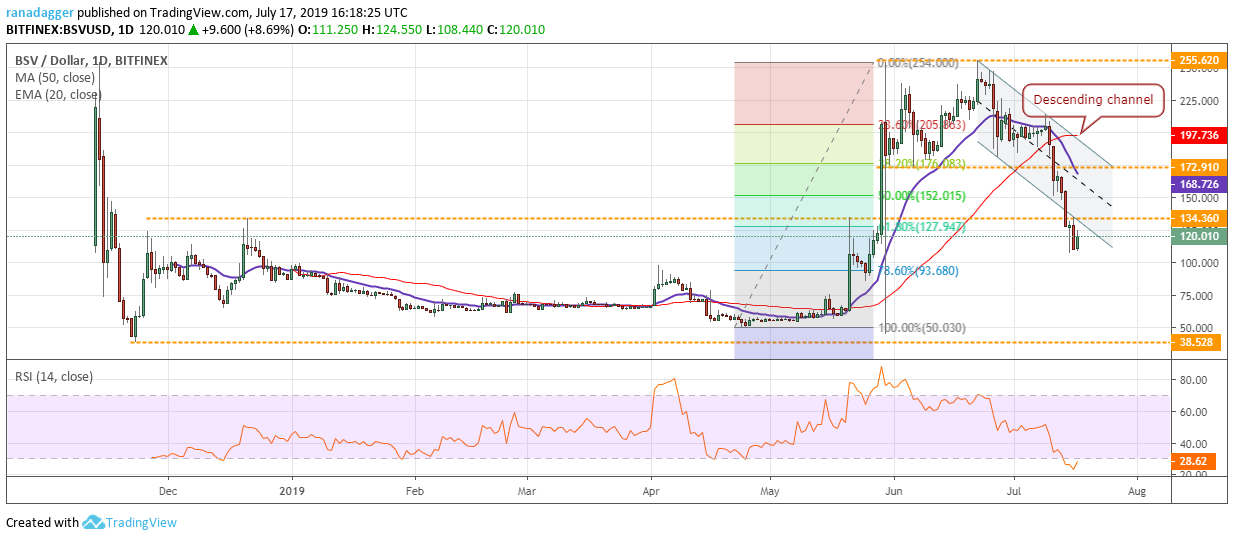
If the BSV/USD pair breaks down of $93.680, the next stop will be at $50.030. With the 20-day EMA sloping down and the RSI in oversold territory, the advantage is clearly with the bears. Nevertheless, if the pair bounces off the current levels and re-enters inside the descending channel, it can rally to the 20-day EMA and above it to the resistance line of the channel. We suggest traders wait for the trend to change before initiating fresh positions.
XLM/USD
Stellar (XLM) broke below the support of $0.080 on July 16. The failure of bulls to defend the support near the yearly lows shows a lack of demand. Both the moving averages are sloping down and the RSI is close to the oversold zone, which suggests that bears are in command.
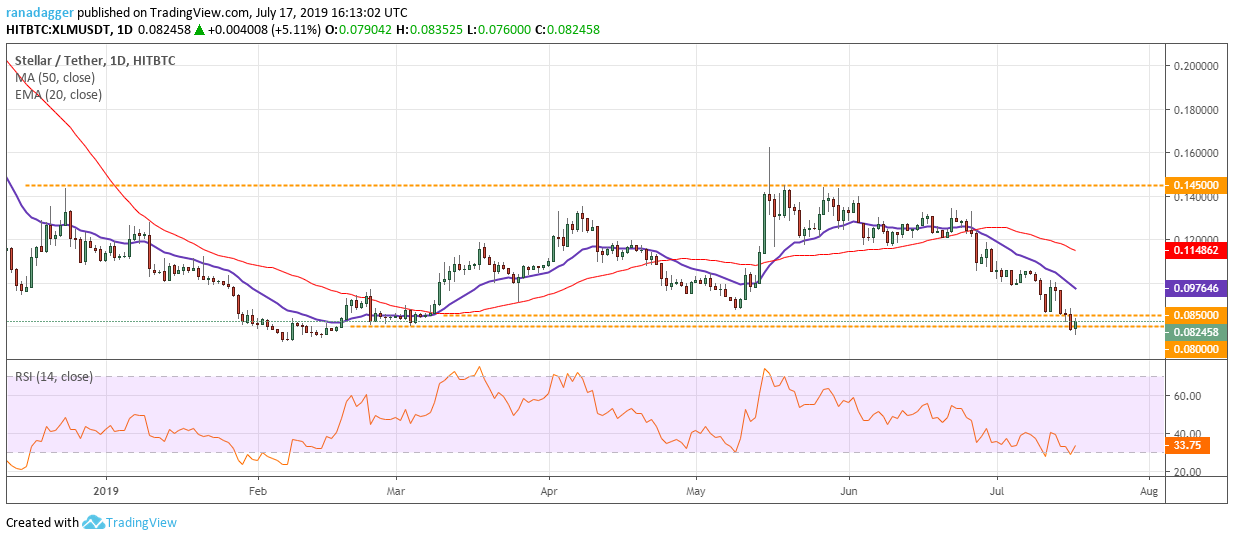
The next support on the downside is at the yearly low of $0.072545. If the bears sink the XLM/USD pair below this level, it will be a huge negative.
However, if the price rebounds from the current levels and climbs above $0.085, it can move up to 20-day EMA. If the next dip stays above $0.08–$0.085 support zone, it will indicate strength and a probable range formation. We will recommend long positions after the boundaries of the range are confirmed. Until then, we remain neutral on the cryptocurrency.
TRX/USD
Tron (TRX) has continued to slide after breaking down of the channel. This shows that long positions are being forced to bail out as the trend has changed from up to down. The 20-day EMA is sloping down and the RSI has dipped close to the oversold territory, which suggests that bears are in control.
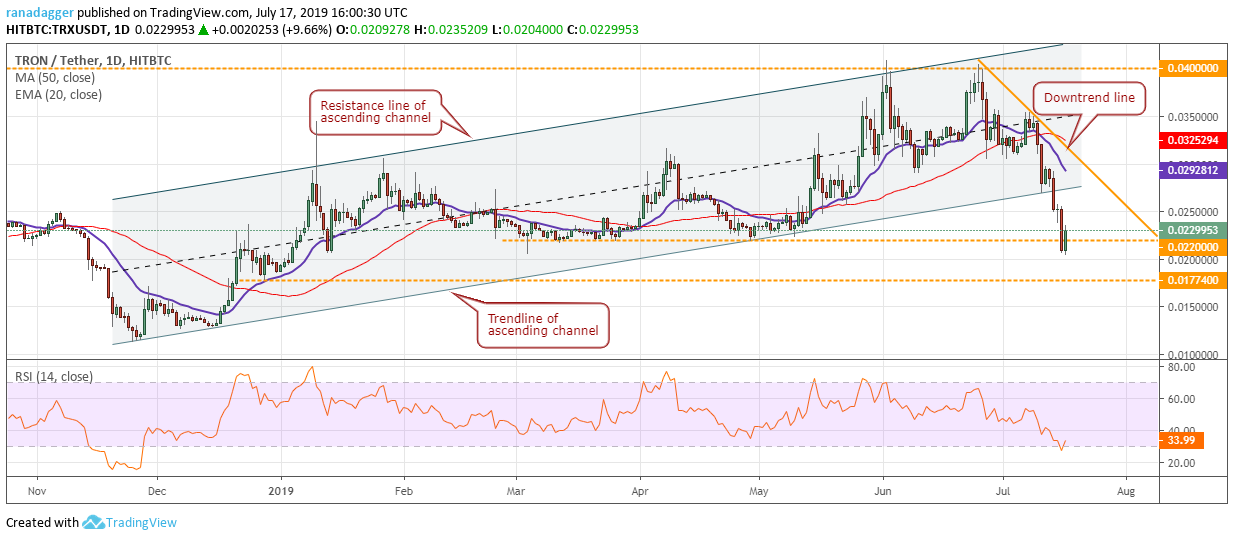
The TRX/USD pair plunged below the support of $0.022 on July 16 but the bulls are presently trying to reclaim the level. If the price fails to sustain above $0.022, the fall can extend to $0.01774.
Conversely, if the price closes (UTC time frame) above $0.022, it can move up to the 20-day EMA, which is likely to act as a stiff resistance. The bulls need to push the price above the downtrend line to signal a trend change.
Market data is provided by the HitBTC exchange.


