
Bitcoin’s rejection at its all-time high and a negative divergence on the RSI suggest that BTC’s bullish momentum could be weakening and altcoins may see profit-booking as a result.
The 2017 Bitcoin (BTC) bull run was led by retail traders, long-term crypto believers and Bitcoin whales. However, the tide turned in 2020 as institutional investors became the catalyst for the latest crypto bull run.
However, data compiled by JPMorgan Chase shows that retail traders have made a strong comeback in the first quarter of this year. JPMorgan analysts used data from Square and Paypal to determine that retail investors bought 187,426 BTC for Q1 2021, which is more than the institutional purchase of 172,684 BTC during the same period.
While this data may not be bulletproof, it gives a good overview of the underlying sentiment from both parties.
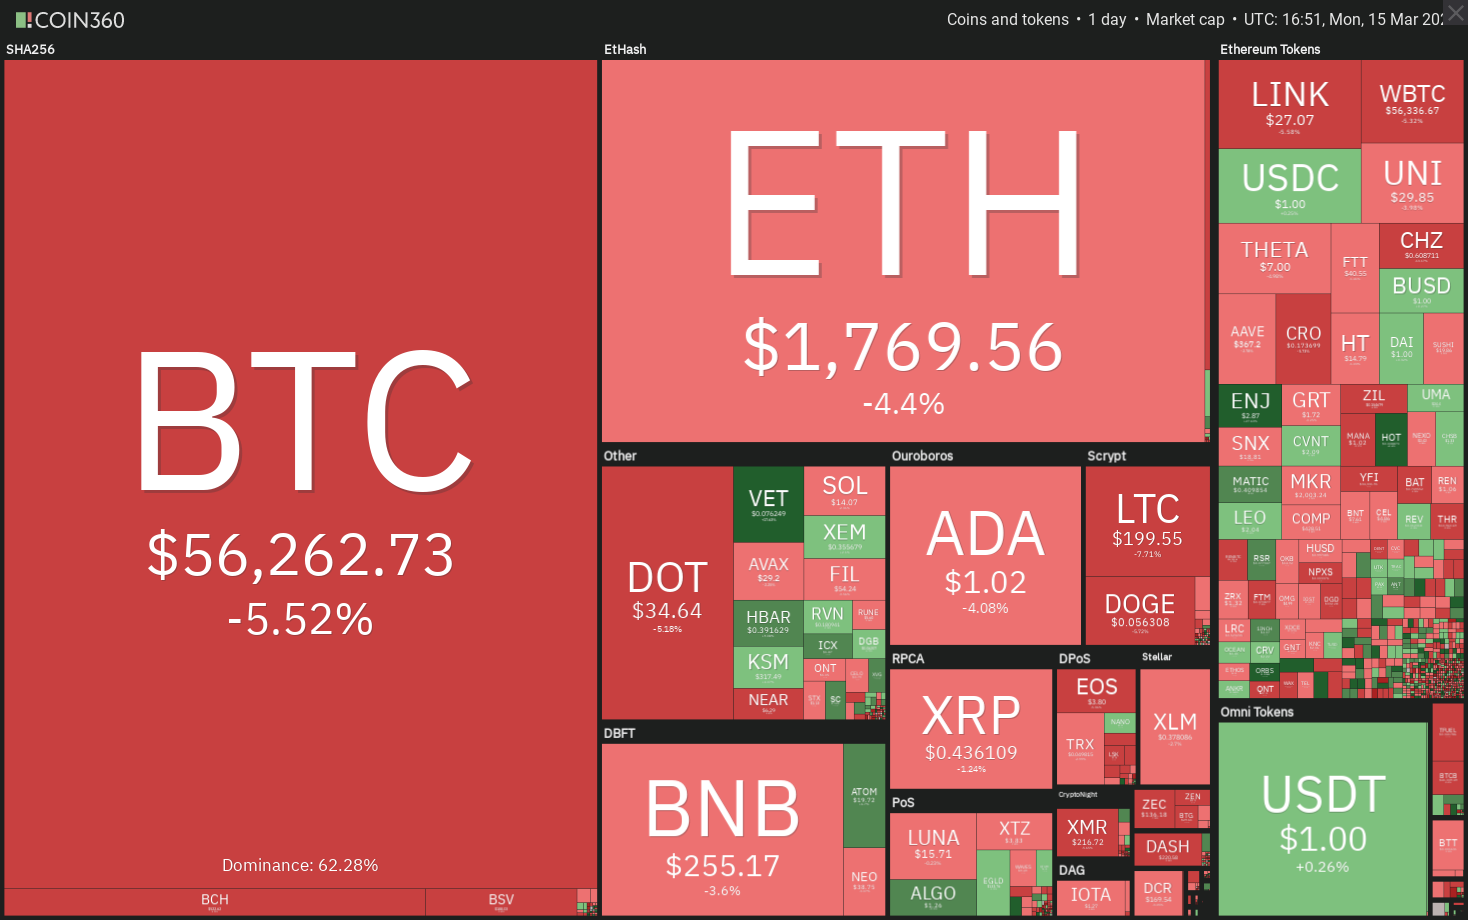
Recent data from CoinMarketCap showed that the total volume of crypto transactions from major South Korean crypto exchanges during a 24-hour period on Sunday was $14.6 billion, eclipsing the $14.5 billion handled by South Korea’s Composite Stock Price Index on March 12.
While increased participation is a positive sign, a strong bull market also attracts several weak hands who dump their positions on every minor news and event. This could lead to increased volatility in the short term.
Let’s study the charts of the top-10 cryptocurrencies to spot the critical support and resistance levels that may attract traders.
BTC/USD
Bitcoin broke out to a new all-time high at $61,825.84 on March 13, but this rally did not attract further buying from traders. On the contrary, traders booked profits after the rally and the price has dipped back below the breakout level at $58,341.03 today.
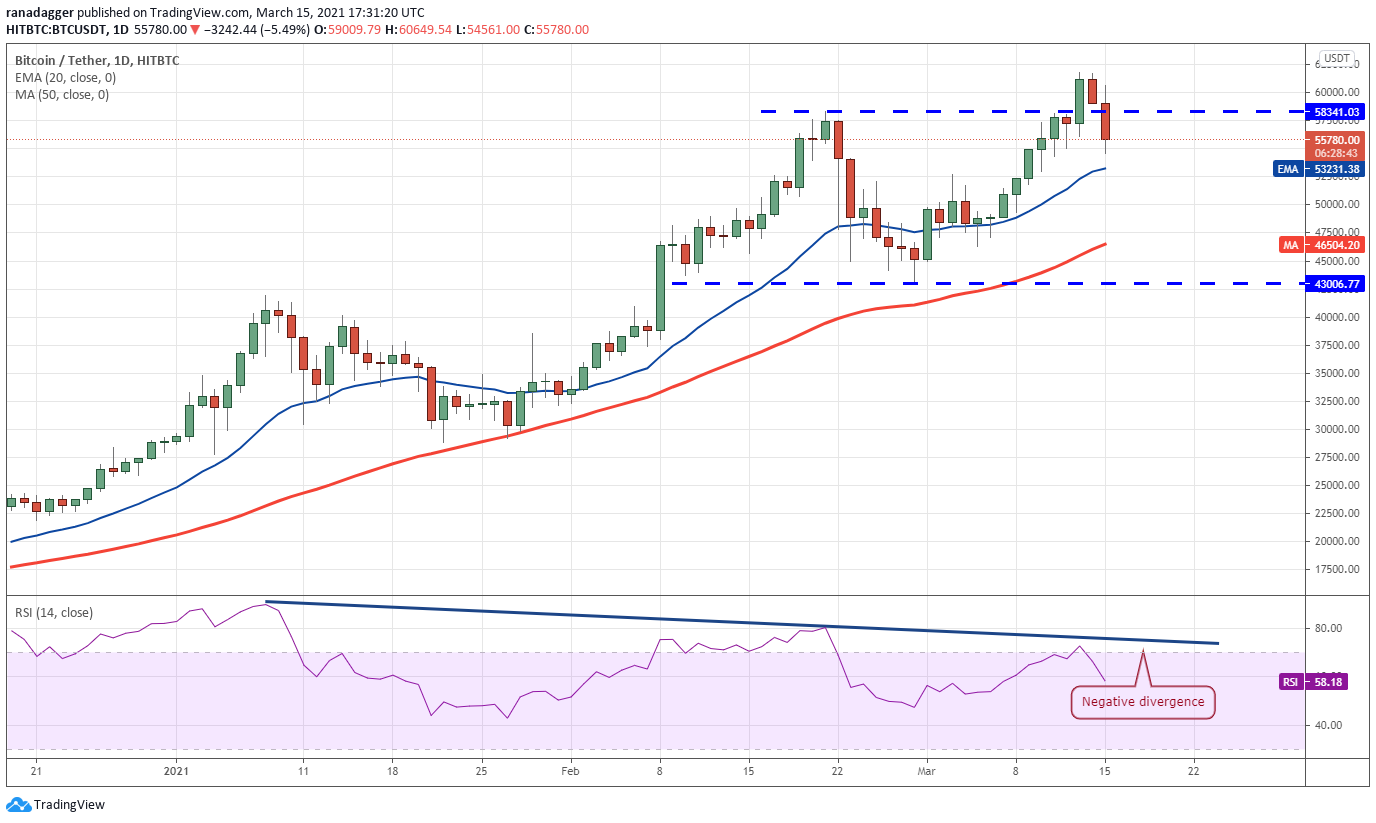
However, a minor positive is that the bulls are still attempting to defend the 20-day exponential moving average ($53,231). If the price rebounds off the 20-day EMA, the bulls will try to drive the price above $61,825.84. If they manage to do that, the next leg of the uptrend to $72,112 could begin.
While the rising moving averages favor the bulls, the negative divergence on the relative strength index (RSI) suggests the bullish momentum has weakened. The bears will see an opportunity if the BTC/USD pair dips and sustains below the 20-day EMA.
The next support on the downside is the 50-day simple moving average ($46,504) and then the critical swing low at $43,006.77.
ETH/USD
Ether’s (ETH) sharp rise on March 13 could not sustain the momentum and retest the all-time high at $2,040.77. This could have attracted profit-booking from momentum traders, which has resulted in a drop to the 20-day EMA ($1,729).
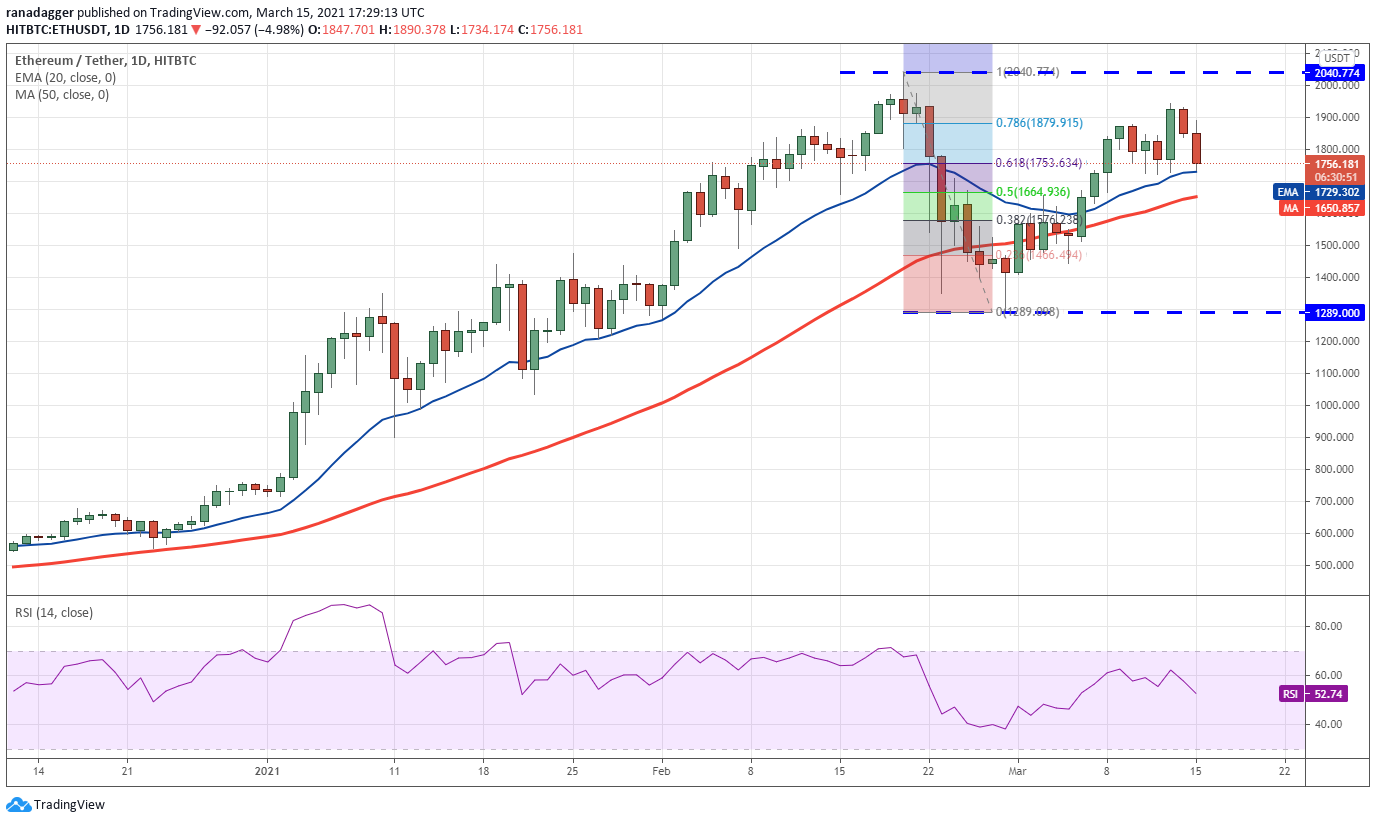
If the bears utilize this opportunity and sink the price below the moving averages, the selling could intensify. That could result in a decline to $1,455 and then to the critical support at $1,289.
The 20-day EMA is flattening out and the RSI has dropped below 53 indicating a balance between supply and demand.
This neutral to negative view will be negated if the ETH/USD pair rebounds off the moving averages and surges above the all-time high. This could start the next leg of the uptrend that may reach $2,614.
BNB/USD
Binance Coin (BNB) could not sustain above the $309.50 overhead resistance on March 11. This could have attracted profit-booking from traders, which has resulted in a pullback to the 20-day EMA ($245) today.
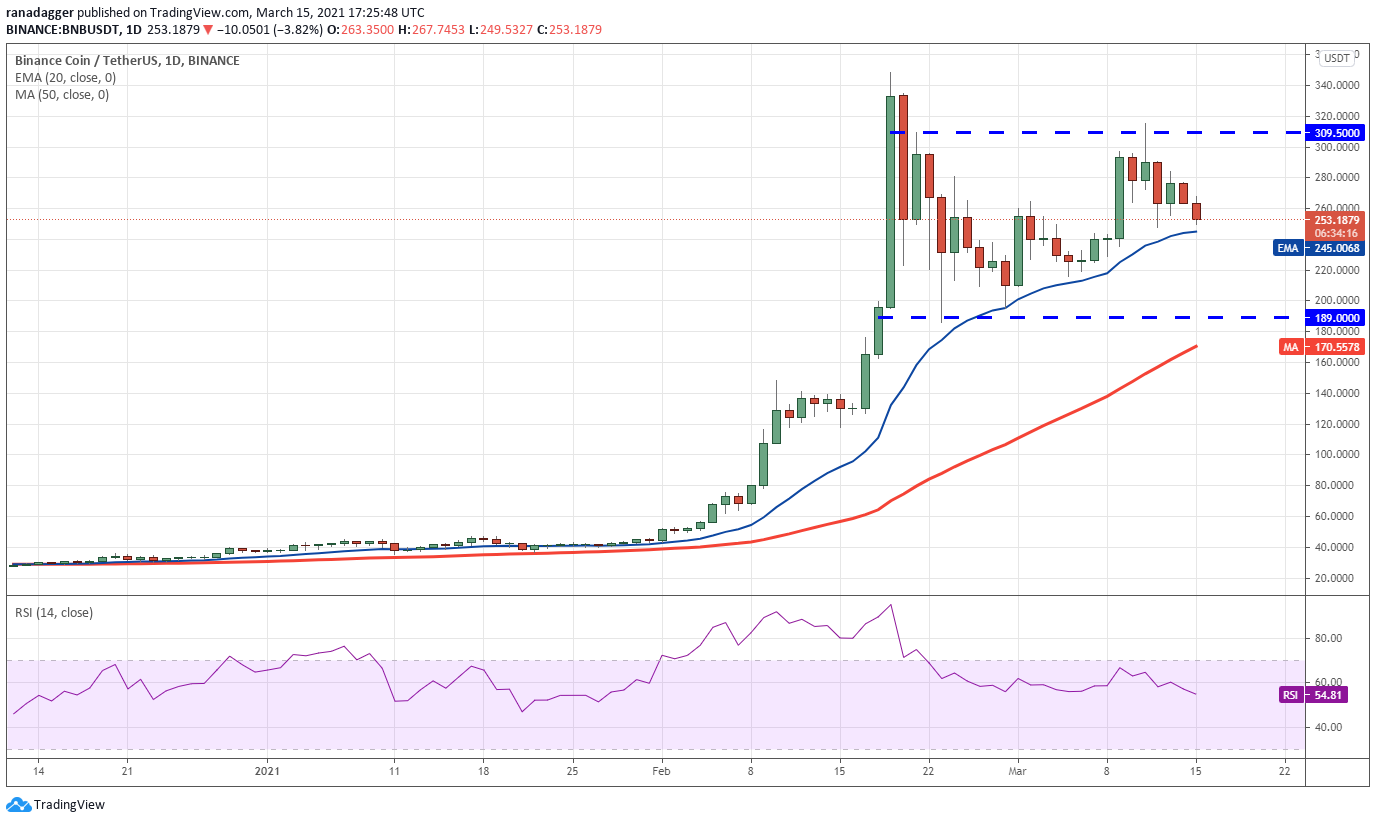
The bulls are currently trying to defend the 20-day EMA. A strong rebound off this support will suggest aggressive buying on dips. The bulls will then again try to push the price above $309.50.
If they succeed, a retest of the all-time high is possible. A breakout of this resistance could start the next leg of the uptrend that could reach $410.
Alternatively, if the BNB/USD pair breaks below the 20-day EMA, short-term traders may book profits and that could pull the price down to $189.
ADA/USD
Cardano (ADA) has been trading inside the $1.03 to $1.23 range for the past few days. The altcoin slipped below the range on March 13 but made a strong comeback on the same day itself. Today, the price has again dipped below the support of the range.
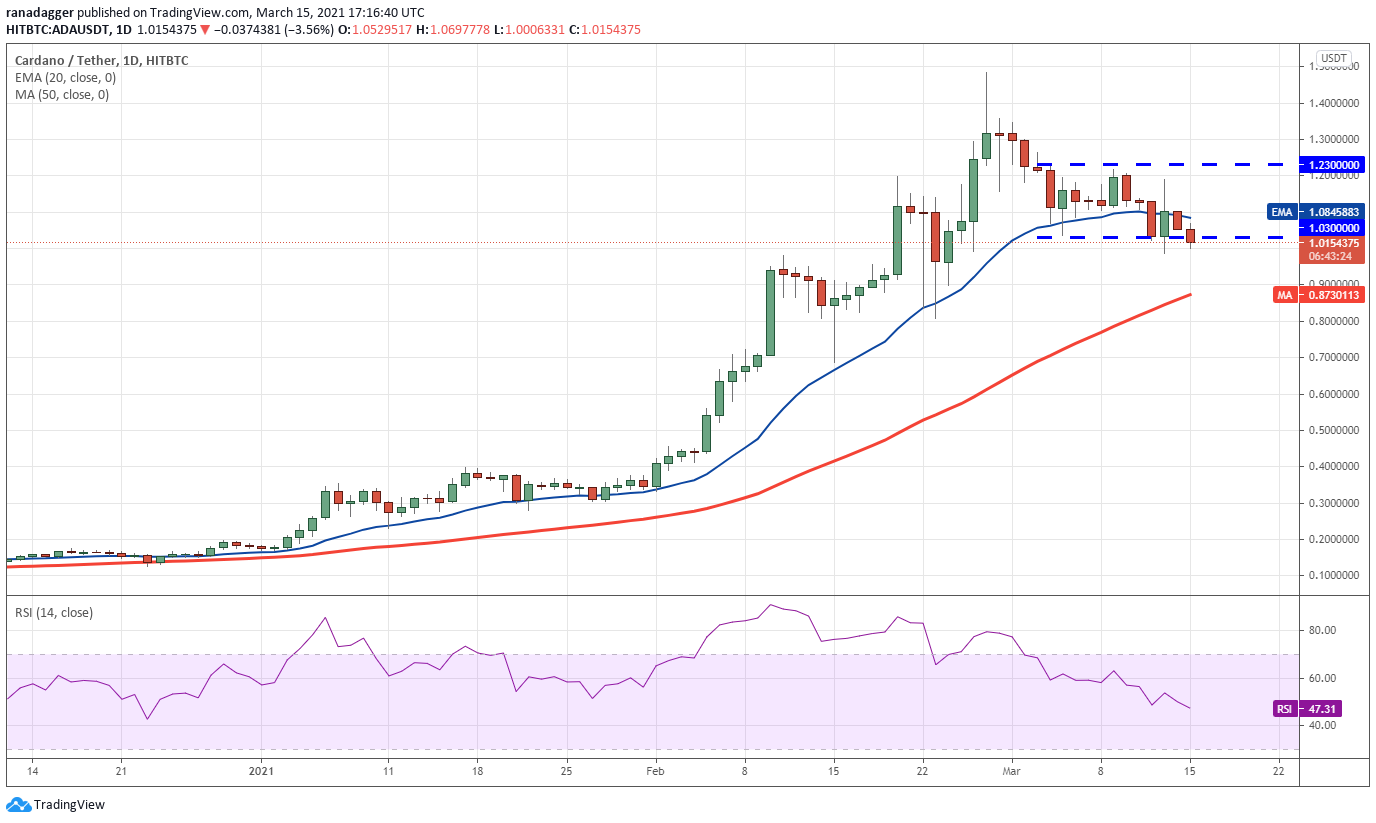
While the bulls have been defending the $1.03 support for the past three days, the bears have not allowed the price to rise and sustain above the 20-day EMA ($1.08). This suggests the bears are attempting to make a comeback.
If the ADA/USD pair closes below the range, it will enhance the prospects of a deeper correction to the 50-day SMA ($0.87). If this support also cracks, the decline could extend to $0.80 and then $0.70.
Contrary to this assumption, if the price turns up and breaks above the 20-day EMA, then the pair could rally to $1.23.
DOT/USD
Although the bulls have successfully defended the 20-day EMA ($34.79) in the past few days, they have not been able to push Polkadot (DOT) above the $37.50 to $40 overhead resistance zone. This suggests that demand dries up at higher levels.
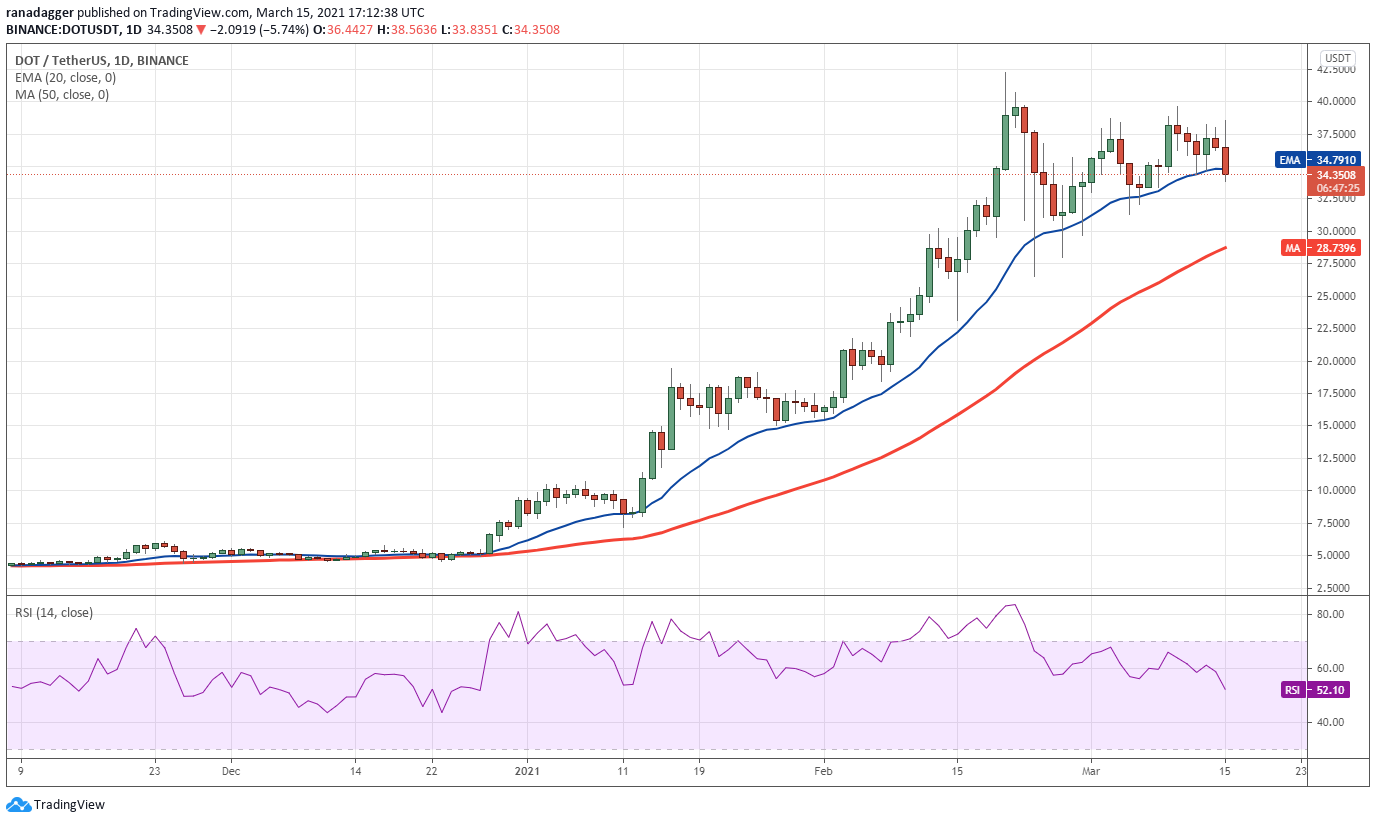
The flattening 20-day EMA and the RSI below 53 suggest the bulls may be losing their grip. If the price sustains below the 20-day EMA, the selling could intensify as the short-term traders may rush to the exit. This could pull the DOT/USD pair down to the 50-day SMA ($28.73).
This bearish view will invalidate if the price turns up from the current level and breaks out of the $40 to $42.50 resistance zone. Such a move could start the next leg of the uptrend that may reach $52.50.
XRP/USD
XRP attempted to rise above the 20-day EMA ($0.45) on March 13 but failed, which shows the bears are trying to gain the upper hand. If the sellers can sink the price below $0.42, the altcoin could drop to $0.35.
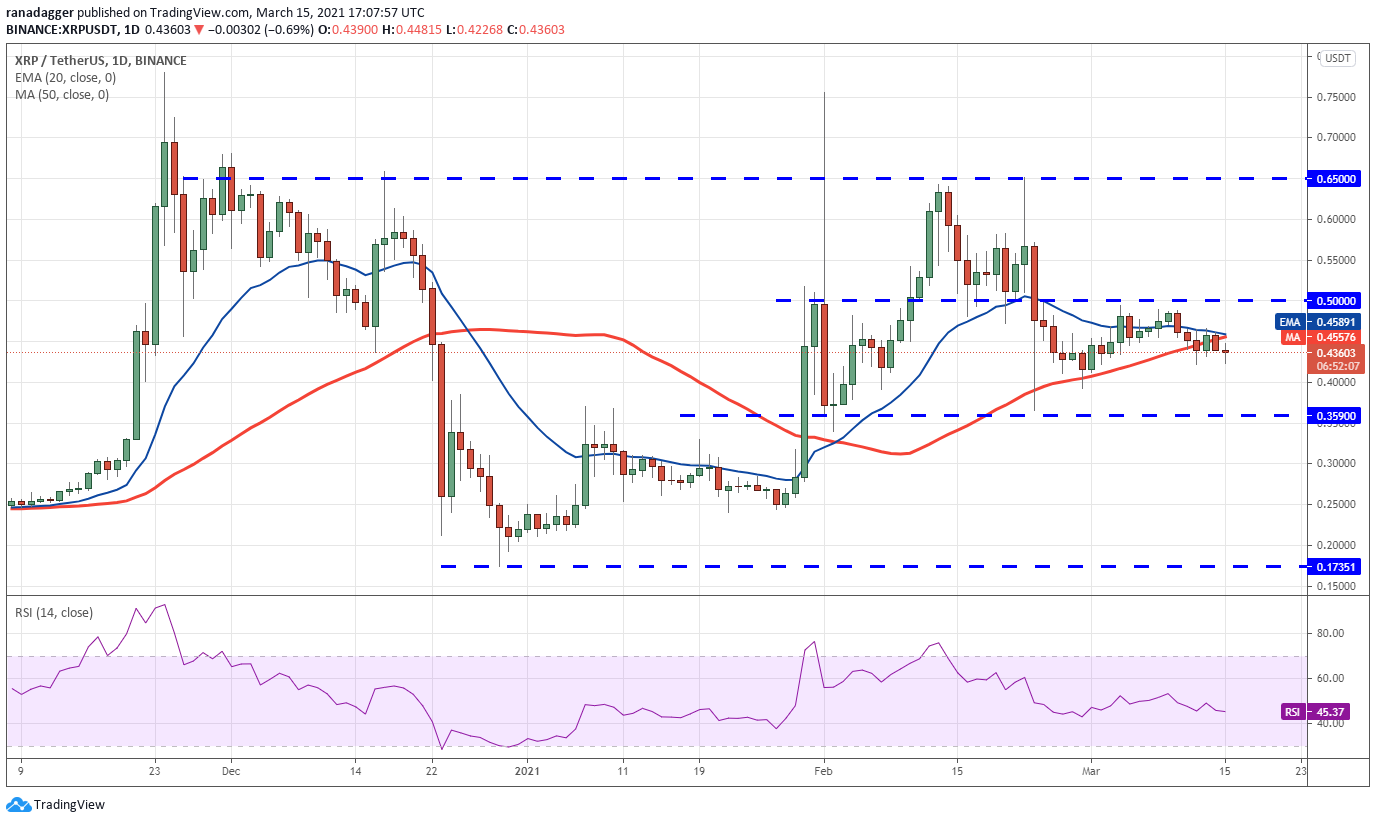
The 20-day EMA is sloping down marginally and the RSI is trading in the negative territory, which suggests a minor advantage to the bears.
This bearish view will be negated if the bulls can push the price above the overhead resistance at $0.50. Such a move could attract buyers who may then try to propel the XRP/USD pair to $0.65.
UNI/USD
Uniswap (UNI) again turned down from the $33 to $34.92 overhead resistance zone on March 14, which shows the bears are active at higher levels. The bulls will now try to defend the 20-day EMA ($28.70).
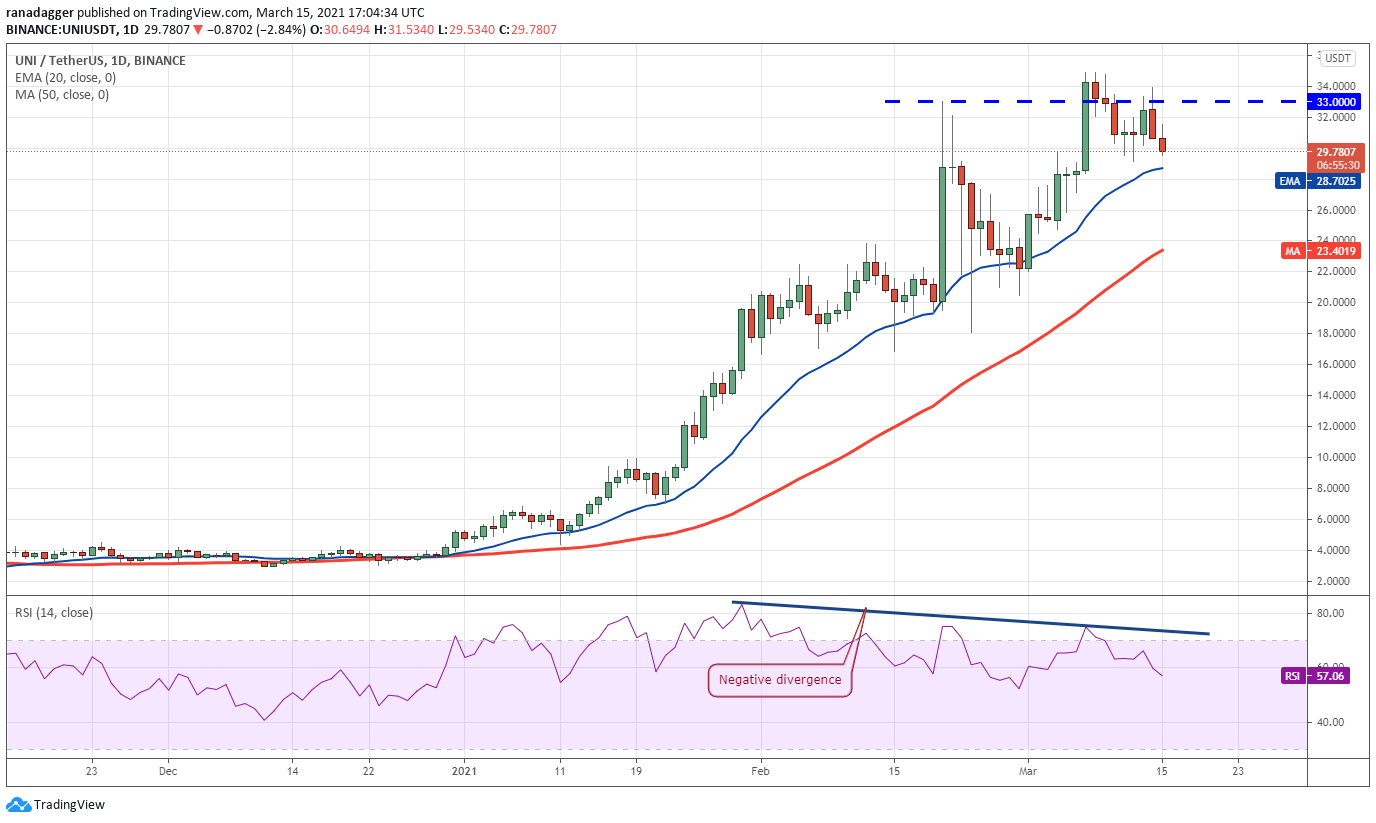
A strong rebound off the 20-day EMA will suggest the sentiment remains bullish and traders are buying on dips. If the LINK/USD pair breaks above the overhead resistance zone, the next leg of the uptrend could begin.
However, the negative divergence on the RSI suggests the bullish momentum may be waning. If the bears sink and sustain the price below the 20-day EMA, a deeper correction to the 50-day SMA ($23.40) is possible.
LTC/USD
Litecoin’s (LTC) break above $205.18 on March 12 sustained its momentum on March 13, but the bulls could not retest $246.96. The altcoin turned down from $230, which shows traders are exiting their positions on rallies.
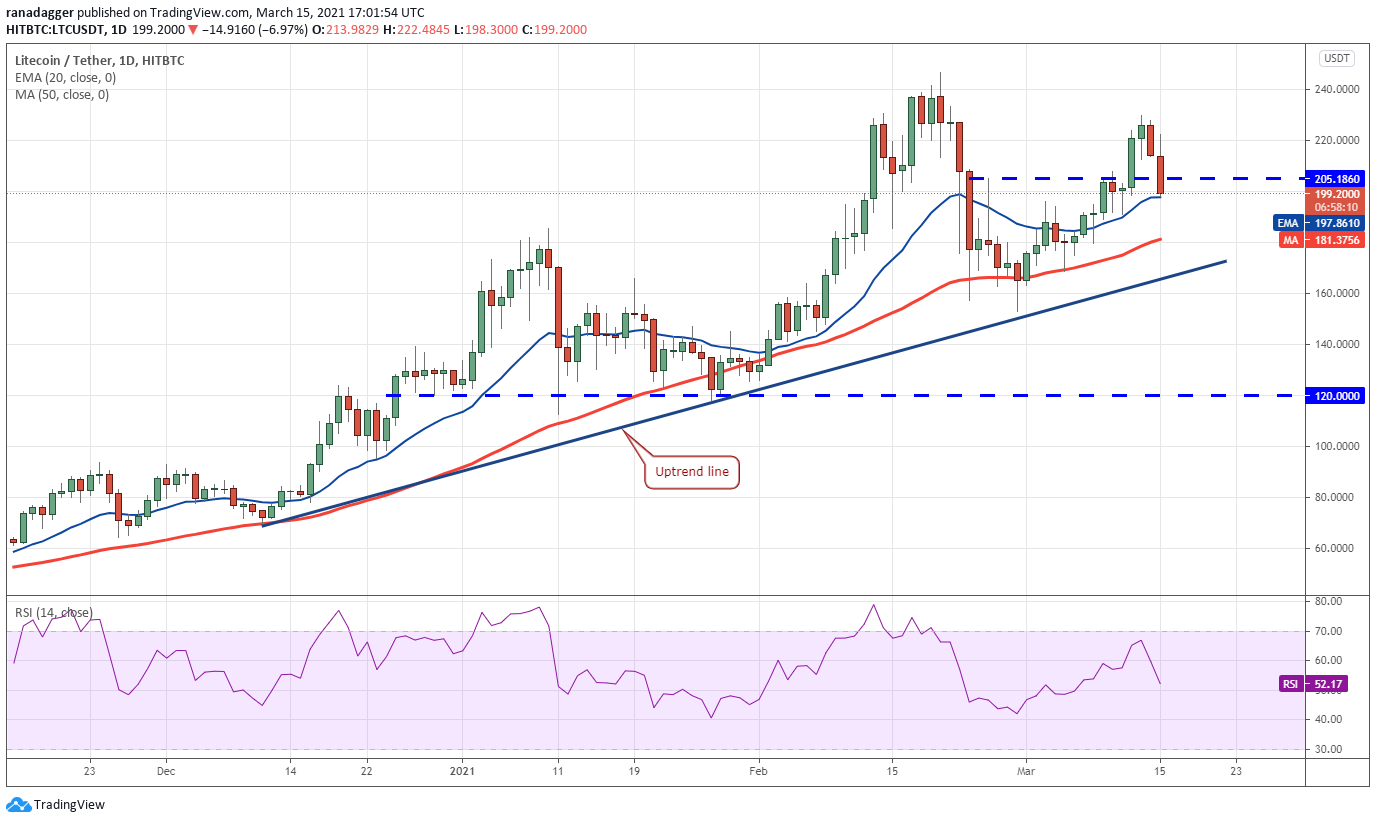
The bears are trying to pull the price back below the 20-day EMA ($197) while the bulls are trying to defend it. The flattening 20-day EMA and the RSI above 52 suggest a balance between supply and demand.
This equilibrium will tilt in favor of the bulls if they can propel the price above $246.96. Conversely, the bears will gain the upper hand if the LTC/USD pair breaks and closes below the uptrend line.
LINK/USD
Chainlink (LINK) has broken below the moving averages and the trendline of the ascending triangle, which invalidates the bullish setup. Traders who had purchased before the breakout might cover their positions and that could result in a fall to $24.
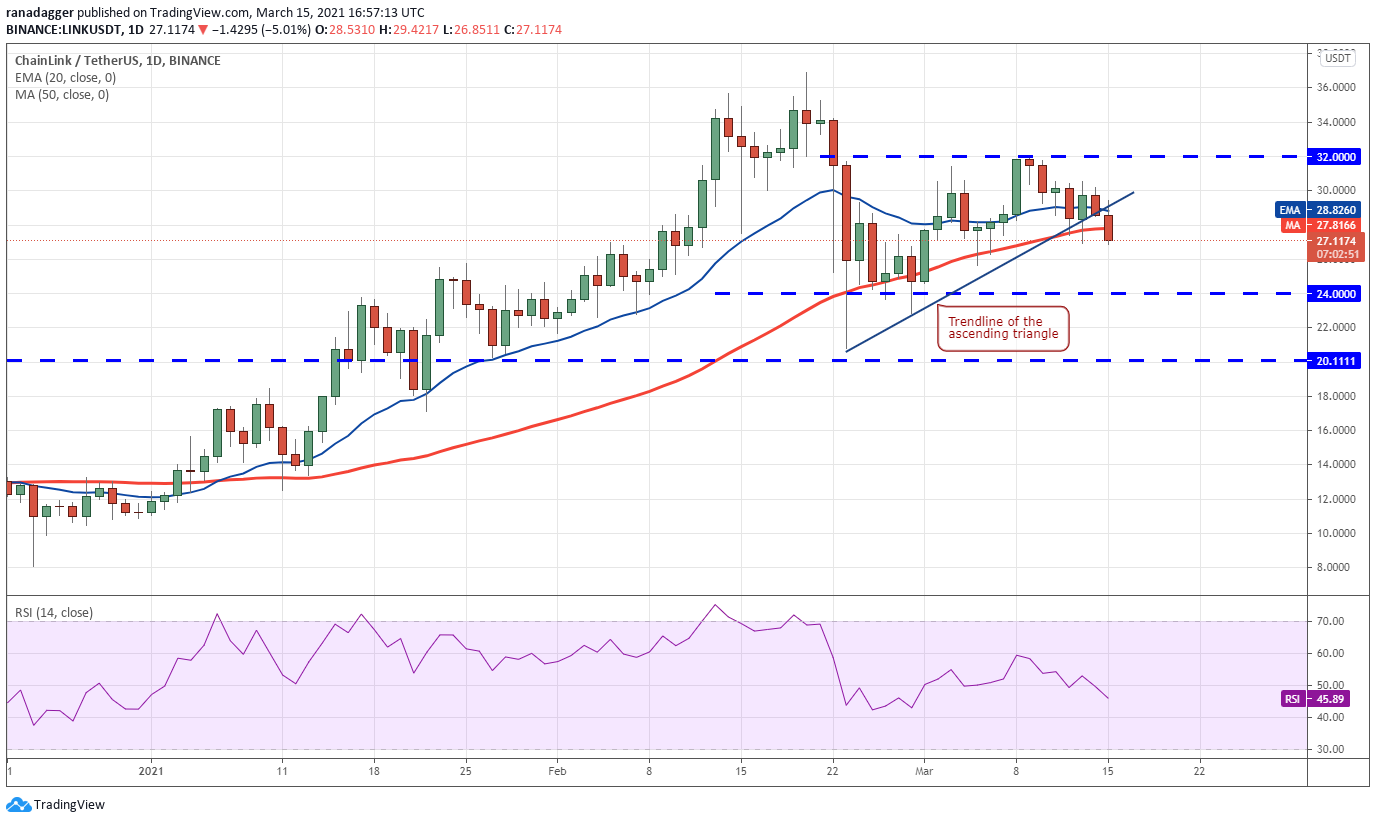
The flat moving averages and the RSI below the center also point to a possible range-bound action in the near term with a negative bias. The trend will turn in favor of the bears if they can sustain the price below $24.
This bearish view will invalidate if the price turns up from the current levels and rises above $32. Such a move will suggest that the current break below the moving averages was a bear trap.
BCH/USD
Bitcoin Cash (BCH) surged above the $560 overhead resistance on March 13, but the bulls could not build on this breakout. The price quickly turned around on March 14 and the bears have dragged it back below the breakout level at $560.
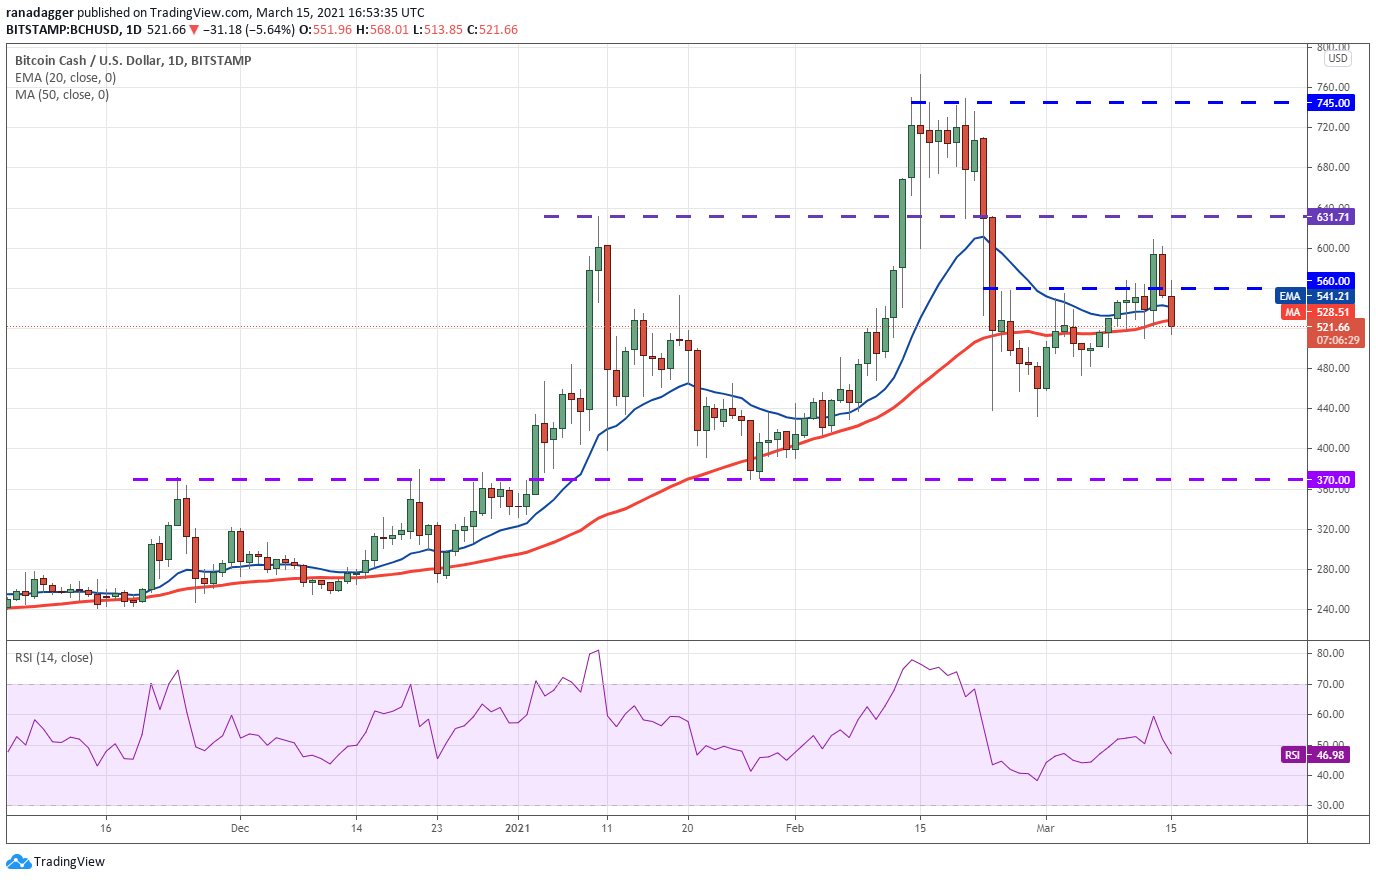
The sharp reversal could have trapped the aggressive bulls who were expecting the BCH/USD pair to rally to $631.71 and then $745. If the price sustains below the 50-day SMA ($528), it increases the possibility of a fall to $480 and then $440.
The flat moving averages and the RSI just below the midpoint indicate a balance between supply and demand. The bulls will gain the upper hand if they can propel the price above $609 and the bears will be at an advantage if the price breaks below $440.
The views and opinions expressed here are solely those of the author and do not necessarily reflect the views of Cointelegraph. Every investment and trading move involves risk. You should conduct your own research when making a decision.
Market data is provided by HitBTC exchange.