The crypto markets are showing some buying at lower levels, which is a positive sign as it shows that investors are accumulating on dips.
The US Federal Reserve is at it again. For the second time this month, the Fed has done an emergency rate cut. On March 3, a 50 basis point cut was implemented and that was followed with a 100 bps cut on March 15. If that was not enough, the Fed also announced a $700 billion quantitative easing program. Surprisingly, in response to this, equities markets reacted by dropping over 11%.
This shows that the markets are signaling to the Fed that rate cuts are not the solution for every problem at hand. After a few months when the coronavirus pandemic is brought under control, all this excess liquidity being pumped into the system will become a huge headache.
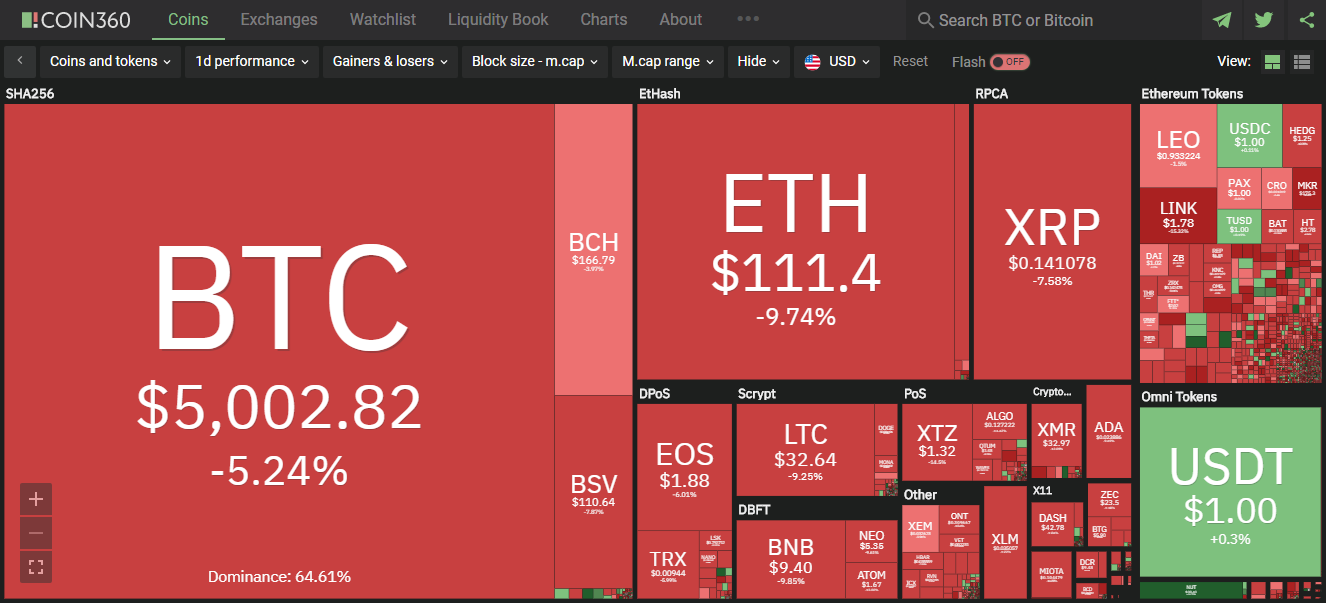
Daily cryptocurrency market performance. Source: Coin360
The initial reaction to this news was positive for cryptocurrencies as the total market capitalization surged from about $147.8 billion to $165.8 billion within minutes. However, the enthusiasm could not sustain and cryptocurrencies again succumbed to selling pressure and the market cap dropped to a low of $127.2 billion.
However, buyers again emerged at lower levels, which is a positive sign as it shows that investors are accumulating on dips. At press time, the market cap had risen to $142.5 billion.
These are unprecedented times where news events will continue to dictate price action and volatility is likely to remain high. Let’s analyze the charts to spot the levels which will signal a possible trend reversal.
BTC/USD
The relief rally in Bitcoin (BTC) stalled just below $6,000 on March 13 and 15. This shows that bears continue to aggressively sell on any minor rallies. Currently, the bears are again attempting to resume the down move.
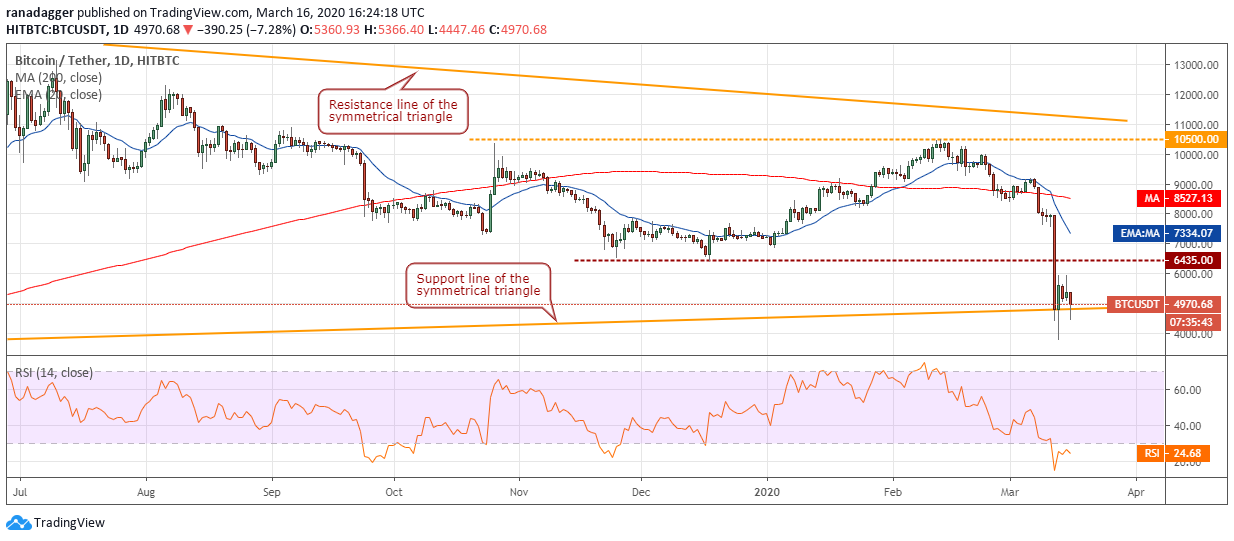
BTC USD daily chart. Source: Tradingview
If the bears can sustain the price below $4,400, a retest of the recent lows at $3,803.58 is possible. The downsloping 20-day EMA and the RSI in the oversold zone suggest that bears are in command.
However, if the bulls again buy the dips below $5,000, the BTC/USD pair might attempt a bounce back to $6,000. A few days of range-bound action between these two levels cannot be ruled out.
We continue to look for buying opportunities but will wait for a reliable buy setup to form before recommending a trade in it.
ETH/USD
Though Ether (ETH) stayed above $117.090 for three days, the bulls could not build on the strength and push the price to $155.612. This shows a lack of buyers at higher levels. Currently, the bears have resumed their selling and the biggest altcoin has dipped below $117.090 once again.
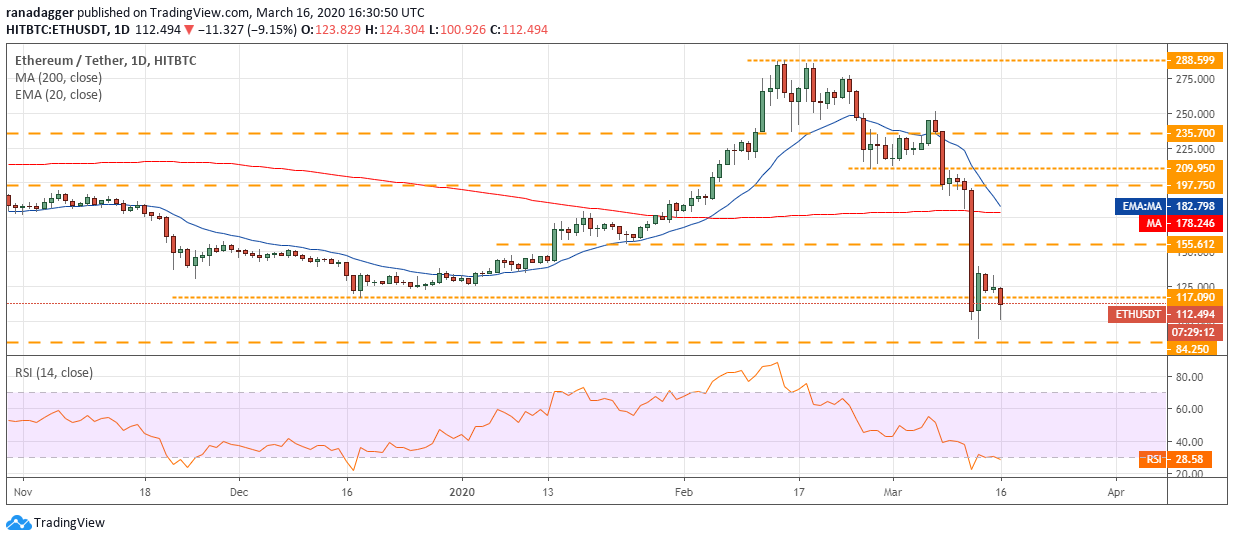
ETH USD daily chart. Source: Tradingview
The bears will try to sink the ETH/USD pair below the strong support at $84.25. If successful, the downtrend will resume and the next major support is at $50.
However, if the buyers step in and buy the current dip, it will show demand at lower levels. If the pair bounces off $100 or the support at $84.25, the bulls will once again attempt a relief rally. The levels to watch on the upside are $139.386 and above it $155.612. We will wait for a trend reversal to be signaled before turning positive.
XRP/USD
The bulls could not propel XRP above the overhead resistance at $0.17468 in the past three days. This shows that the bears continue to aggressively defend the resistance levels. The failure to move up has attracted sellers.
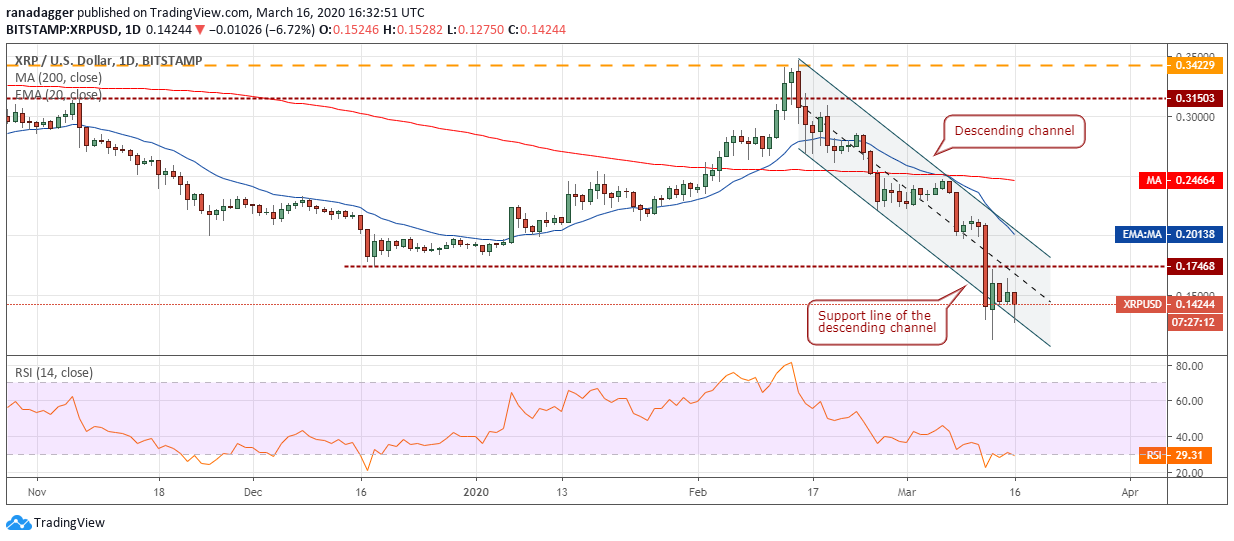
XRP USD daily chart. Source: Tradingview
Currently, the bears are attempting to resume the down move but the bulls are trying to keep the XRP/USD pair inside the descending channel.
If the bears succeed in breaking below the channel, a retest of the recent lows at $0.1140 is possible. If this support cracks, the downtrend can exceed to $0.10 and below that $0.075.
Conversely, if the pair stays inside the channel, a move to $0.17468 is likely. If the price turns down from this level once again, a few days of range-bound action is possible. However, if the bulls can push the price above $0.17468, a rally to the 20-day EMA at $0.20 is likely. We will wait for the pair to sustain above the descending channel before turning positive.
BCH/USD
Bitcoin Cash (BCH) has been trading around the $169.62 mark for the past three days. Though the price had surged on March 13, the bulls could not sustain the rally. This shows a lack of sustained buying at higher levels.
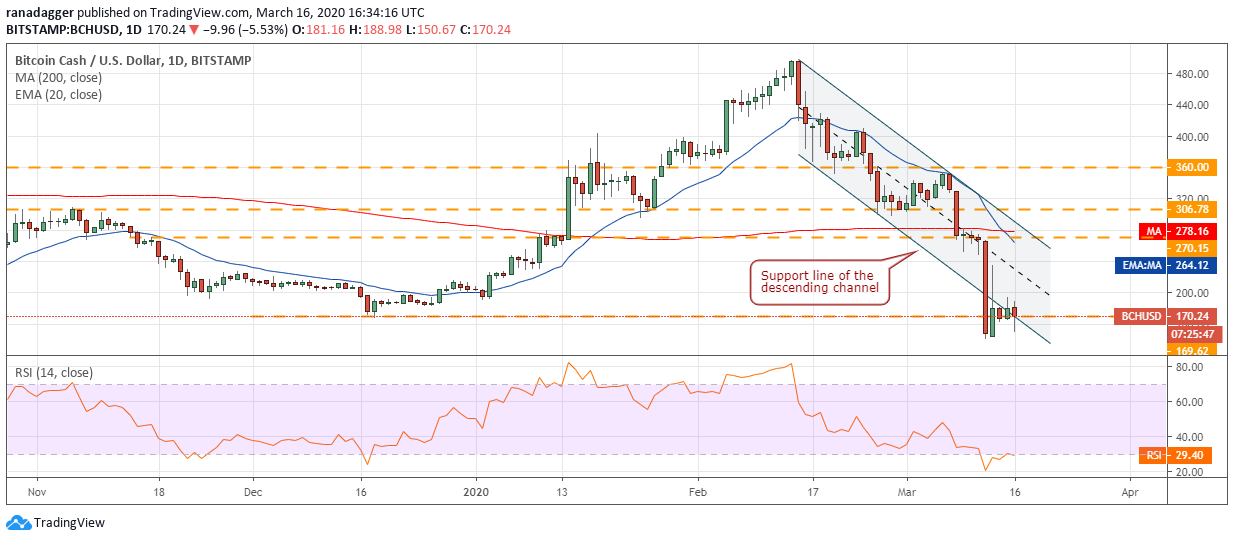
BCH USD daily chart. Source: Tradingview
Today, though the bears attempted to sink the BCH/USD pair below the recent low of $141.11, the bulls stepped in and purchased at lower levels.
This is a positive sign as the pair has again risen to about $169.62 levels. If the bulls can sustain the price above $200, a rally to the 20-day EMA at $264 is possible. On the other hand, if the bears can sink the pair below $141.11, a drop to the next support at $105 is possible.
BSV/USD
The rebound off the lows at $82.771 could only reach a high of $131.460 on March 15. Currently, the bears are attempting to resume the down move. If Bitcoin SV (BSV) breaks below the $82.771-$78.506 support, the downtrend will resume.
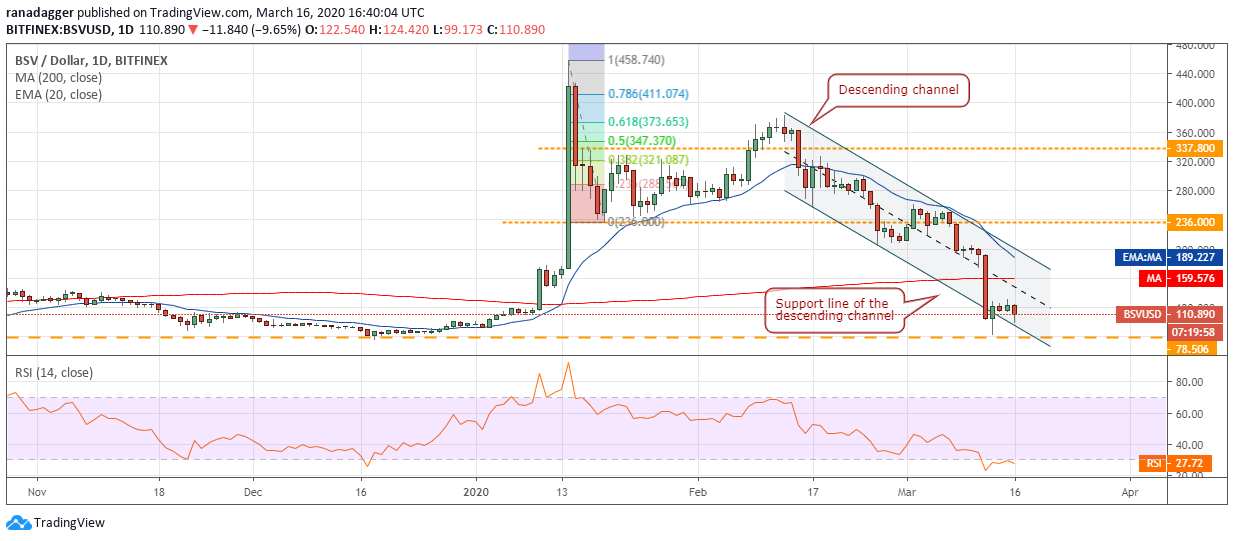
BSV USD daily chart. Source: Tradingview
Below $78.506, the next level to watch is $66.666 and if that also fails to provide support, the decline can extend to $50.
Conversely, if the BSV/USD pair bounces off $82.771, a few days of range-bound action is possible. We will wait for the price to break above the 200-day SMA and the descending channel before turning positive.
LTC/USD
The pullback in Litecoin (LTC) from the lows at $23.9777 stalled at the overhead resistance zone of $35.8582-$38.8015. This shows that the bears continue to aggressively defend the resistance levels.
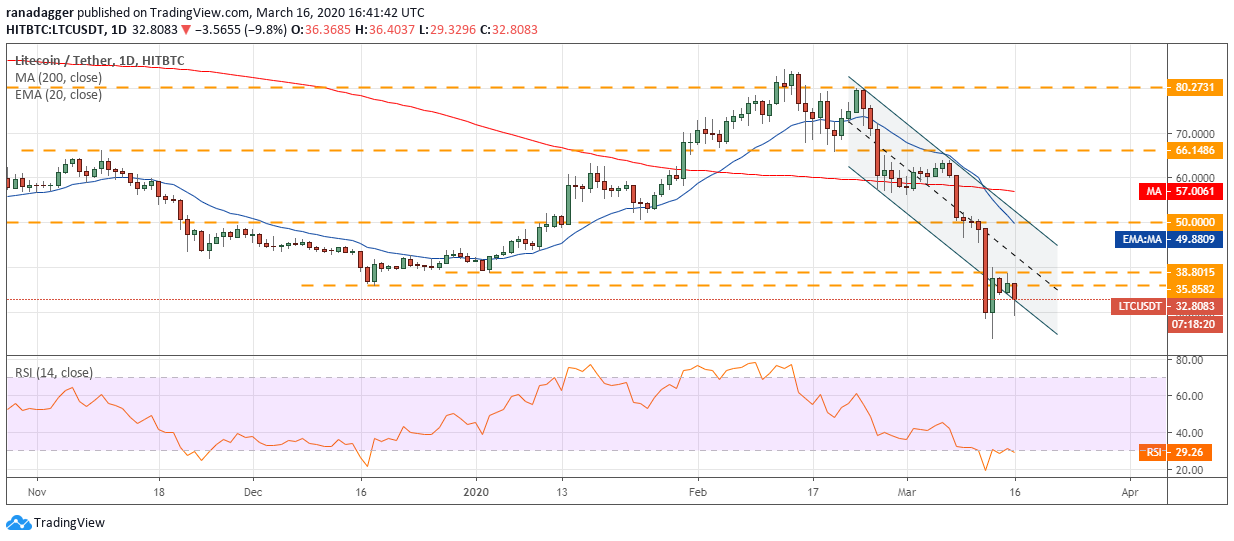
LTC USD daily chart. Source: Tradingview
Currently, the bears are again attempting to resume the downtrend. If the LTC/USD pair dips below $23.9777, a drop to $20 is possible.
Conversely, if the pair reverses direction from the current levels or $23.9777, a few days of range-bound action is likely. A break above $38.8015 will be the first sign that buyers are back in the game.
EOS/USD
EOS could not rise above the $2.1624-$2.4001 resistance zone, which shows that bears are unwilling to let go of their advantage. If the bears can sink the altcoin below the recent low at $1.42, the next stop is likely to be the psychological support at $1.
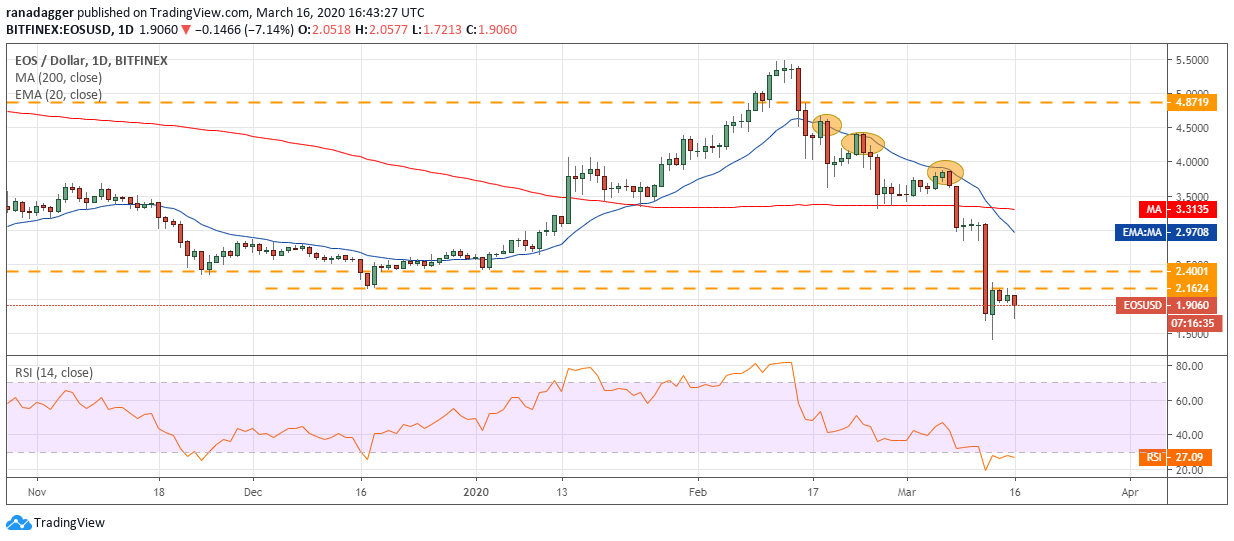
EOS USD daily chart. Source: Tradingview
However, if the EOS/USD pair bounces off the support at $1.42, a few days of consolidation is possible.
The first sign of strength will be if the pair can sustain above $2.4001. As the price had turned down from the 20-day EMA on three previous occasions, we will wait for the pair to climb and sustain above it before recommending a trade.
BNB/USD
Binance Coin (BNB) has been trading below the overhead resistance of $12.1111 for the past three days, which shows a lack of buyers at higher levels. The bears would make one more attempt to resume the downtrend by breaking below the recent low of $6.38.
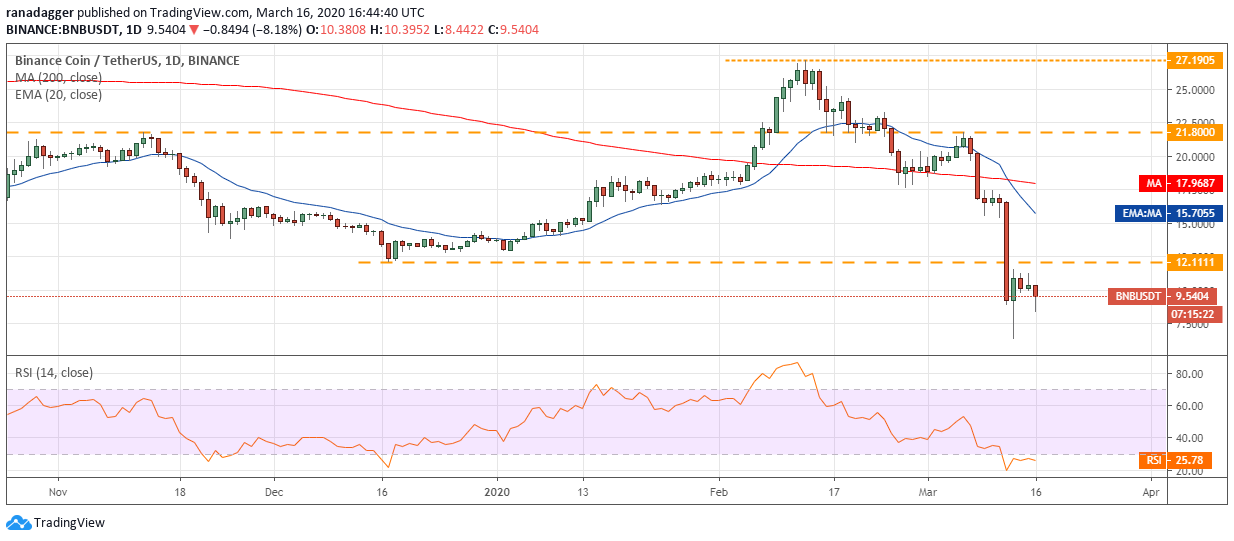
BNB USD daily chart. Source: Tradingview
If successful, the decline can extend to the next psychological round figure of $5. We anticipate the bulls to aggressively defend the zone between $4 to $5.
Conversely, if the BNB/USD pair can reverse direction from the current levels or from the lows at $6.38, a few days of range-bound action is likely. The pair will show signs of strength on a break above $12.1111 and is likely to pick up momentum after the price sustains above the 20-day EMA. Until then, we remain neutral on the pair.
XTZ/USD
The bears did not allow Tezos (XTZ) to re-enter the descending channel. This is a negative sign as it shows that the buyers are still not confident that a low is in place. The failure to rise inside the channel has attracted fresh bout of selling.
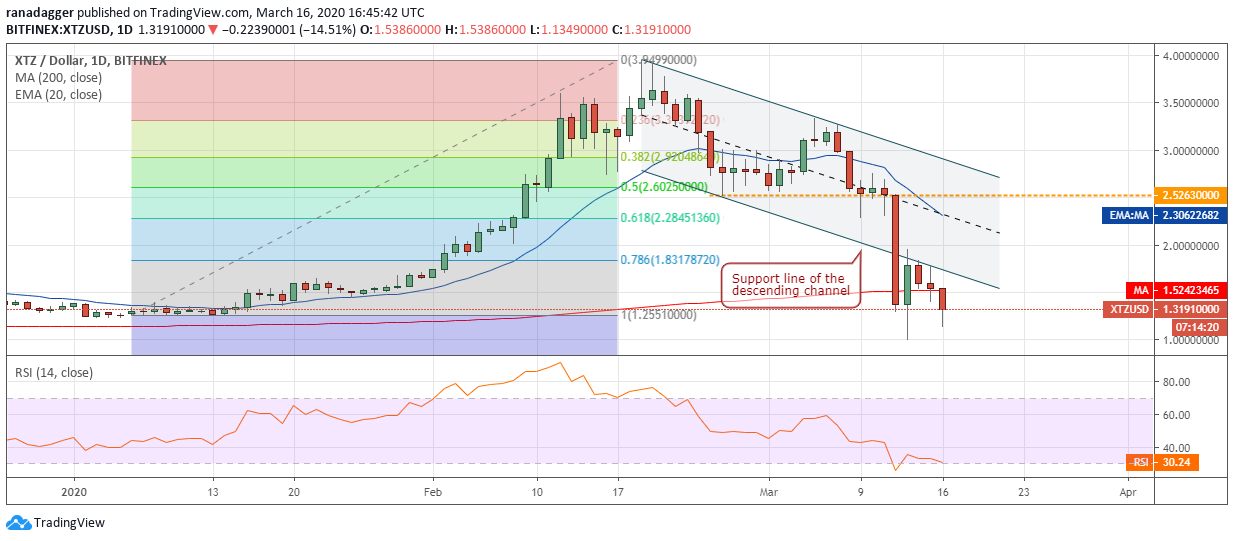
XTZ USD daily chart. Source: Tradingview
If the bears can sink the price below the recent low of $1.0096, it will be a huge negative. Below this level, the drop can extend to $0.85.
Conversely, if the bulls defend the support at $1.0096, we might see another attempt to push the XTZ/USD pair back into the channel. A break above $2 will be the first sign that buyers are back in action. We will wait for a new buy setup to form before suggesting a trade in it.
LEO/USD
UNUS SED LEO (LEO) continues to be an outperformer as it has still not seen panic selling engulf it. The altcoin has gradually slided to the support at $0.9081. We expect the bulls to defend this support aggressively.
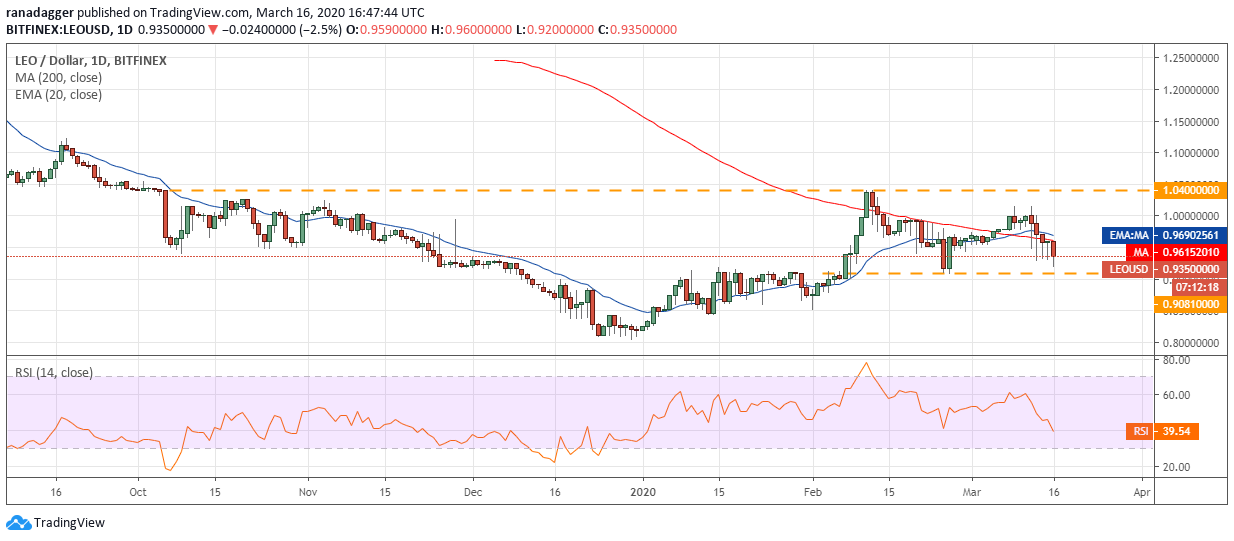
LEO USD daily chart. Source: Tradingview
If successful, the LEO/USD pair will remain range-bound between $0.9081-$1.04 for a few more days.
Contrary to our assumption, if the bears sink the pair below $0.9081, a drop to the next support at $0.85 is likely. If this support also cracks, a retest of $0.80512 is possible. On the upside, a break above $1.04 will be a huge positive.
The views and opinions expressed here are solely those of the author and do not necessarily reflect the views of Cointelegraph. Every investment and trading move involves risk. You should conduct your own research when making a decision.
Market data is provided by HitBTC exchange.