

Ripple (XRP)trade is currently trading at $0.2840. Recently, the digital coin’s price has broken the resistance of $0.28, turning it into support. The next resistance levl is at $0.2921. The XRP price might start moving between the channels and the above levels can be used for swing trading.
Dow Theory
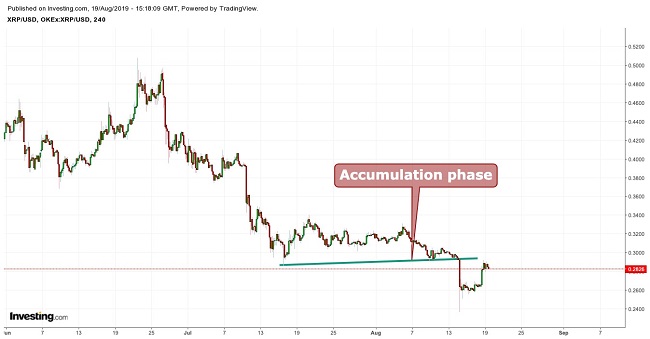
According to Dow Theory, the virtual coin is currently appearing in the accumulation phase, which is an area from where the price shoots up, and is generally considered a great buying point. This is the time when informed investors (experienced traders and institutions) are usually entering their positions.
The price movements of the cryptocurrency during the accumulation phase are slow. The accumulation phase often falls into the end of a downtrend.
Moving Average
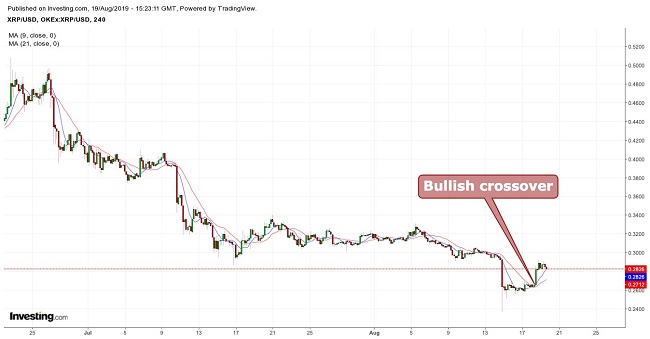
When taking 9 period moving averages (blue) with 21 period moving averages (red), a bullish crossover is seen and also the price is moving above the 9 period moving average, indicating a positive momentum. Long positions can be taken as long as Ripple’s price is above the moving averages.
Bollinger Bands
The XRP price is moving between the channels. The channel is expanding, indicating an increased price volatility, and therefore long positions can be taken while keeping the middle average line as support.

Conclusion
Ripple (XRP)trade is currently trading at $0.2840. Resistance level is at $0.2921 with support level at $0.280. Long positions can be taken, keeping the support level as a stop loss. The channel formed between the resistance and support can be used for swing trading.
The overall trend is bullish, provided the digital coin trades above the support level and is above the 9 period moving average. Mid-term target is $0.3078. If it again breaks the support then the virtual coin can again test the $0.264 levels.
Pivot Points
| Name | S3 | S2 | S1 | Pivot Points | R1 | R2 | R3 |
| Classic | 0.1630 | 0.1997 | 0.2326 | 0.2693 | 0.3022 | 0.3389 | 0.3718 |
| Fibonacci | 0.1997 | 0.2263 | 0.2427 | 0.2693 | 0.2959 | 0.3123 | 0.3389 |
| Camarilla | 0.2464 | 0.2527 | 0.2591 | 0.2693 | 0.2719 | 0.2783 | 0.2846 |
| Woodie’s | 0.1612 | 0.1988 | 0.2308 | 0.2684 | 0.3004 | 0.3380 | 0.3700 |
Technical Indicators
| Name | Value | Action |
| RSI(14) | 39.621 | Sell |
| STOCH(9,6) | 23.935 | Sell |
| STOCHRSI(14) | 11.268 | Oversold |
| MACD(12,26) | -0.022 | Sell |
| ADX(14) | 39.291 | Sell |
| Williams %R | -82.934 | Oversold |
| CCI(14) | -110.3324 | Sell |
| ATR(14) | 0.0628 | Less Volatility |
| Highs/Lows(14) | -0.0504 | Sell |
| Ultimate Oscillator | 43.315 | Sell |
| ROC | -23.924 | Sell |
| Bull/Bear Power(13) | -0.0985 | Sell |

If You Liked This Article Click To Share


