

Ripple failed to clear the key $0.3080 resistance and declined sharply against the US Dollar. XRP price is down 5%, but there are many key supports on the downside.
- Ripple price started a strong decline after it was rejected near the $0.3080 area against the US dollar.
- The price is down more than 5% and it is approaching the $0.2680 support area.
- There was a break below a key ascending channel with support near $0.2920 on the hourly chart of the XRP/USD pair (data source from Kraken).
- The price is likely to find a strong buying interest near $0.2680 or $0.2500.
Ripple Price Approaching Key Supports
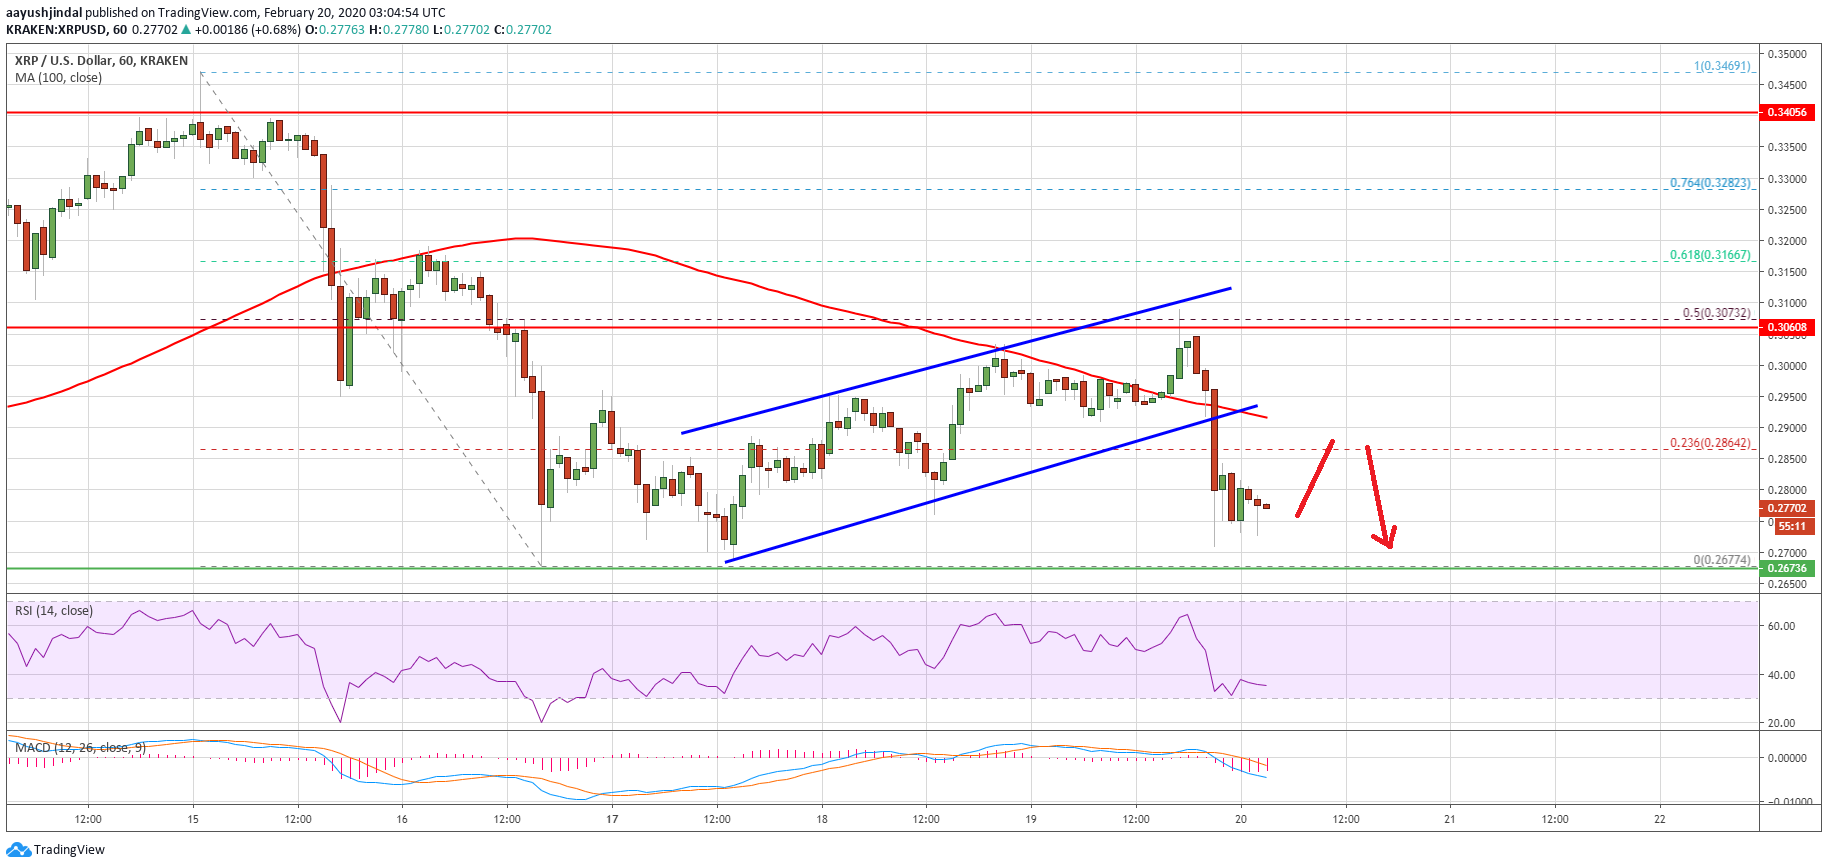
Yesterday, we saw a decent recovery wave in ripple above $0.2800 resistance. XRP price even climbed above the $0.2950 resistance and the 100 hourly simple moving average.
Besides, there was a break above the 23.6% Fib retracement level of the downward move from the $0.3470 high to $0.2675 swing low. However, the upward move was capped by the key $0.3070 and $0.3080 resistance levels (as discussed yesterday).
Moreover, the 50% Fib retracement level of the downward move from the $0.3470 high to $0.2675 swing low acted as a strong hurdle for the bulls. As a result, ripple price started a strong decline below the $0.2900 support area.
During the decline, there was a break below a key ascending channel with support near $0.2920 on the hourly chart of the XRP/USD pair. It opened the doors for more losses below the $0.2850 support and the 100 hourly simple moving average.
The price is down more than 5% and it is trading near the $0.2750 level. On the downside, the first key support is near the $0.2700 and $0.2680 levels. The main support is near the $0.2500 area, where the bulls are likely to take a stand. Any further losses could lead the price towards the $0.2200 support area.
Another Recovery?
If ripple stays above the $0.2680 support area, it could start another recovery wave. An initial resistance is near the $0.2900 resistance and the 100 hourly simple moving average.
To start a convincing upward move, the price must gain traction above the $0.3000 and $0.3080 resistance levels. If not, there is a risk of a drop towards the $0.2500 support area in the near term.
Technical Indicators
Hourly MACD – The MACD for XRP/USD is currently moving in the bearish zone.
Hourly RSI (Relative Strength Index) – The RSI for XRP/USD is now well below the 50 level, with a few recovery signs.
Major Support Levels – $0.2700, $0.2680 and $0.2500.
Major Resistance Levels – $0.2880, $0.2900 and $0.3000.


