

Ripple is currently consolidating above the $0.1720 support against the US Dollar. XRP price seems to be preparing for a bullish break above the $0.1800 resistance region.
- Ripple price is facing a couple of important hurdles near the $0.1780 and $0.1800 levels against the US dollar.
- The price is trading well below the 100 simple moving average (4-hours) and $0.1900.
- There is a crucial bearish trend line forming with resistance near $0.1780 on the 4-hours chart of the XRP/USD pair (data source from Kraken).
- The pair is likely to start a fresh increase if it clears the $0.1780 and $0.1800 resistance levels.
Ripple Price Approaching Next Break
After diving below $0.1700, ripple started a slow and steady recovery. XRP price traded above the $0.1700 and $0.1720 levels to move into a short-term positive zone.
There was a break above the 23.6% Fib retracement level of the downward move from the $0.1868 high to $0.1689 low. However, the price is facing a couple of important hurdles near the $0.1780 and $0.1800 levels.
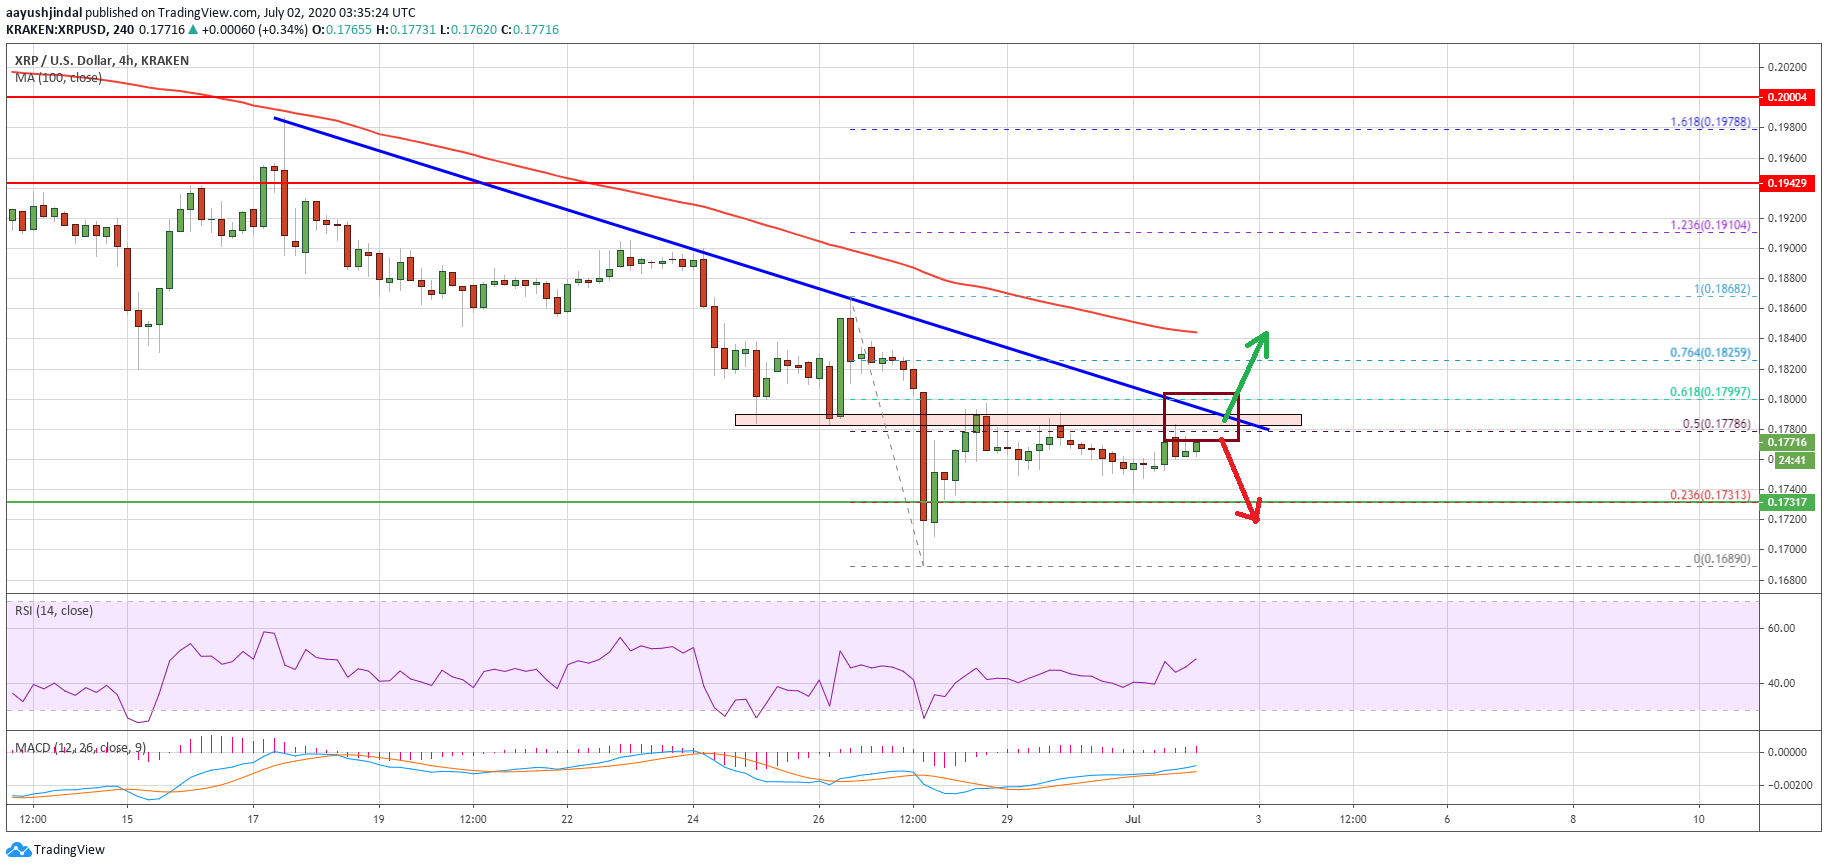
There is also a crucial bearish trend line forming with resistance near $0.1780 on the 4-hours chart of the XRP/USD pair. The trend line is close to the 50% Fib retracement level of the downward move from the $0.1868 high to $0.1689 low.
Ripple price below $0.1800. Source: TradingView.com
It seems like ripple is preparing for a crucial upside break above the $0.1800 resistance. If bitcoin climbs above the $9,300 resistance, there are high chances of a bullish break in XRP above $0.1800.
The next key resistance above $0.1800 is near the $0.1850 level and the 100 simple moving average (4-hours). Any further gains could lead the price towards the next set of hurdles near $0.1900 and $0.1920 in the coming sessions.
Fresh Decline in XRP?
If ripple price fails to surpass the $0.1780 and $0.1800 resistance levels, there are chances of a fresh decline. An initial support is near the $0.1730 level.
The first key support is near the $0.1720 level, below which the price might continue to move down. The next support is near the $0.1680 level, followed by the $0.1650 pivot level.
Technical Indicators
4-Hours MACD – The MACD for XRP/USD is slowly gaining momentum in the bullish zone.
4-Hours RSI (Relative Strength Index) – The RSI for XRP/USD is currently approaching the 50 level.
Major Support Levels – $0.1720, $0.1680 and $0.1650.
Major Resistance Levels – $0.1780, $0.1800 and $0.1850.
Take advantage of the trading opportunities with Plus500
Risk disclaimer: 76.4% of retail CFD accounts lose money.


