
Since plunging as low as $8,600 earlier this week, Bitcoin has mounted a strong comeback that took prices as high as $9,900 on June 4th and 5th.
The more than 10% bounce has convinced many traders of the bull case, hence why funding on futures exchanges remains positive, showing longs are more aggressive than shorts. Yet analysts are starting to fear that the rally to $9,900 is just noise in a bearish medium-term trend.
Related Reading: No, Bitcoin Forming a Weekly TD Sequential “9” Doesn’t Kill the Bull Trend
Bitcoin Is Trading In a Wyckoff Distribution, Analysts Assert
Analyst Adam Li noted that Bitcoin’s recent price action from April to today looks similar to a schematic laid out by prominent technical analyst Richard Wyckoff.
Over his career, he made a number of schematics that he saw appear on the charts of assets time and time again. They are separated into two types: the bullish Wyckoff Accumulations and the bearish Wyckoff Distributions.
According to Li’s analysis, Bitcoin’s price action looks like the start of a Wyckoff Distribution. Should the pattern play out in full, the cryptocurrency will plunge to the $7,000s by September.
Wyckoff Distribution chart shared by Adam Li, a cryptocurrency trader. A Wyckoff Distribution is a bearish pattern.
Li isn’t the only analyst currently suggesting Bitcoin is trading like an asset going through a Wyckoff Distribution.
A prominent pseudonymous trader shared that while there are a number of ways you can interpret the recent price action, the volume is showing signs of distribution:
“Volume-wise I can’t look past distribution up here given the reaction to the high sweep. There are very few re-accumulation ranges that we would expect to see that contain a move above the range which was so strongly rejected. Typically in a re-accumulation structure this move would hold, not come back inside. That’s usually one of our first signs of distribution,” the analyst wrote in reference to this week’s attempted (and failed) breakout past $10,500.
Technical Trends Corroborate Bear
Technical indicators corroborate the bearish charts.
A trader shared at the end of May that BTC’s weekly chart is printing four clear signs that the asset is rolling over to the downside. They are as follows:
- The Tom Demark Sequential, an indicator that prints “9” signals at or near important points in an asset’s trend, just printed a “9.”
- Hidden bearish divergences are forming between the Klinger trend indicator and the price.
- Bitcoin formed a “Heikin-Ashi spinning top” pattern last week, which suggests a reversal of the bull trend.
- The Stochastic Relative Strength Index (RSI), which tracks momentum has seen a bearish cross for the first time since February.
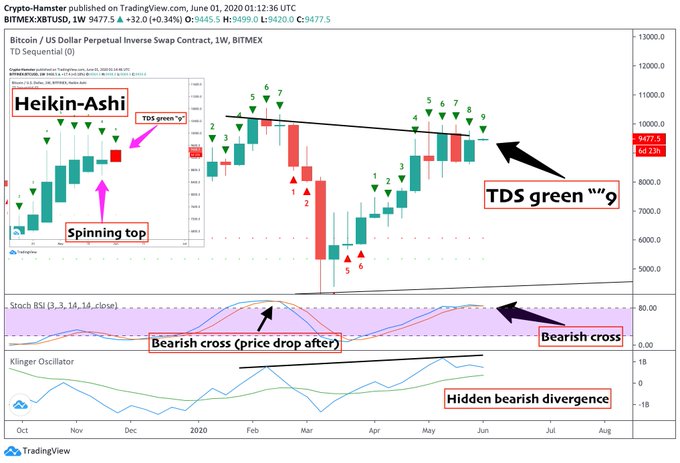
Chart from Crypto Hamster (@CryptoHamsterIO on Twitter).
Adding to this, John Bollinger, the prominent technical analysis behind the Bollinger Bands indicator, recently wrote:
“The is a Head Fake at the upper Bollinger Band for $btcusd, time to be cautious or short.”
Related Reading: Crypto Tidbits: $200M of Bitcoin Liquidated, Ethereum DeFi Adoption Limited, Bloomberg Is Bullish
Featured Image from Shutterstock
Price tags: xbtusd, btcusd, btcusdt,
Textbook Wyckoff Analysis Shows Bitcoin Is About to See a Brutal Drop to $7,000s