Bitcoin’s prolonged bout of sideways trading is bound to end eventually, and all the signs are suggesting that the next large trend-defining movement could take place in the coming days or weeks.
This recent price action has been driven primarily by a sharp decline seen in BTC’s liquidity and trading volume – both signs of investors’ heightened interest in the altcoin market.
Because of this, the cryptocurrency’s trading range has now narrowed to between $9,100 and $9,200.
The last time BTC saw volatility levels this low was right before it plunged by over 50% in November of 2018.
One data analyst is now noting that a historical analysis of the movements seen after bouts of low volatility show that they often result in upwards breakouts.
As such, there is a strong possibility that Bitcoin soon tests its high time frame resistance at $10,500.
Bitcoin Volatility Sets Another Record Low as Investors Move to Altcoins
At the time of writing, Bitcoin is trading down marginally at its current price of $9,180.
This is in the middle of the tight range it has formed between $9,100 and $9,200.
Many investors view this trading range as a spring coiling up, with its tightness and duration both magnifying the size of its subsequent movement.
It is possible that BTC will continue trading sideways until investors begin rotating profits away from altcoins and towards the benchmark digital asset.
The altcoin market’s near-term price action will likely play an important role in Bitcoin’s next trend, as traders have been siphoning liquidity and trading volume away from BTC in order to fuel the uptrends posted by many smaller tokens.
This has caused the benchmark crypto’s volatility to hit another historic low.
Analytics platform Skew spoke about this in a recent tweet, explaining that its price has moved up or down by less than 1% on average over the past ten days.
“Bitcoin 10 days realized volatility = 16% It means bitcoin moved less than 1% up or down on average over the last ten days. Last time this happened in November 2018, bitcoin sold off nearly 50% thereafter,” Skew noted.
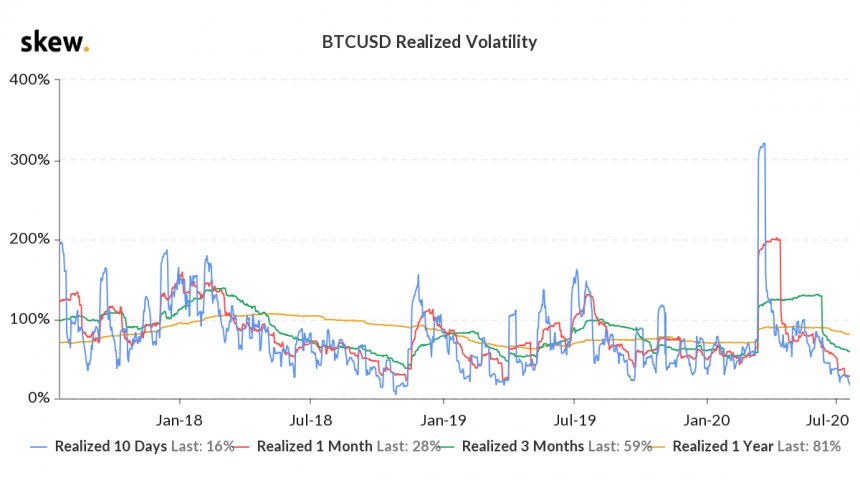
Image Courtesy of Skew
This Model Shows BTC is Statistically Likely to Break Upwards
One data analyst who goes by the name “Alpha Zeta” explained in a recent tweet that an analysis of previous periods of prolonged sideways trading shows that Bitcoin is statistically likely to break upwards.
“What happens to BTC’s price after low vol periods (part 2). Another quick analysis. Here we look at low vol periods (30 day vol < 30% on x axis) and what happens to price after 30 days (on y axis). Seems like the break is very often to the upside (above blue line),” he explained.
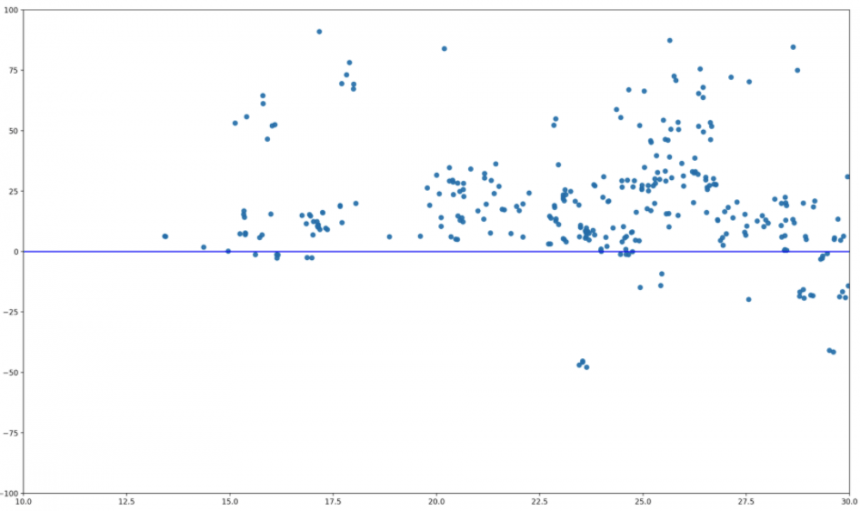
Image Courtesy of Alpha Zeta.
How Bitcoin reacts to its macro range boundaries at $9,000 and $10,000 should be one of the main factors that determines its mid-term trend.
Featured image from Unsplash.

Pricing data via TradingView.