

Bitcoin price revered losses and climbed to a new 2020 high at $10,406 against the US Dollar. BTC is now eyeing another bullish wave above $10,500 in the near term.
- Bitcoin is gaining bullish momentum above the $10,000 and $10,200 resistance levels against the US Dollar.
- The price is likely to continue higher above $10,400 and $10,500 in the near term.
- There is a bullish continuation pattern forming with resistance near $10,385 on the hourly chart of the BTC/USD pair (data feed from Kraken).
- There are chances of a bullish break above the $10,406 high and $10,500.
Bitcoin Rally Could Extend Further
Recently, we saw a downside correction in bitcoin below the $10,000 and $9,850 support levels against the US Dollar. BTC price tested the $9,700 area and formed a decent support base.
As a result, there was a fresh increase above the $9,850 resistance and the 100 hourly simple moving average. Moreover, yesterday’s declining channel was breached near the $9,760 level.
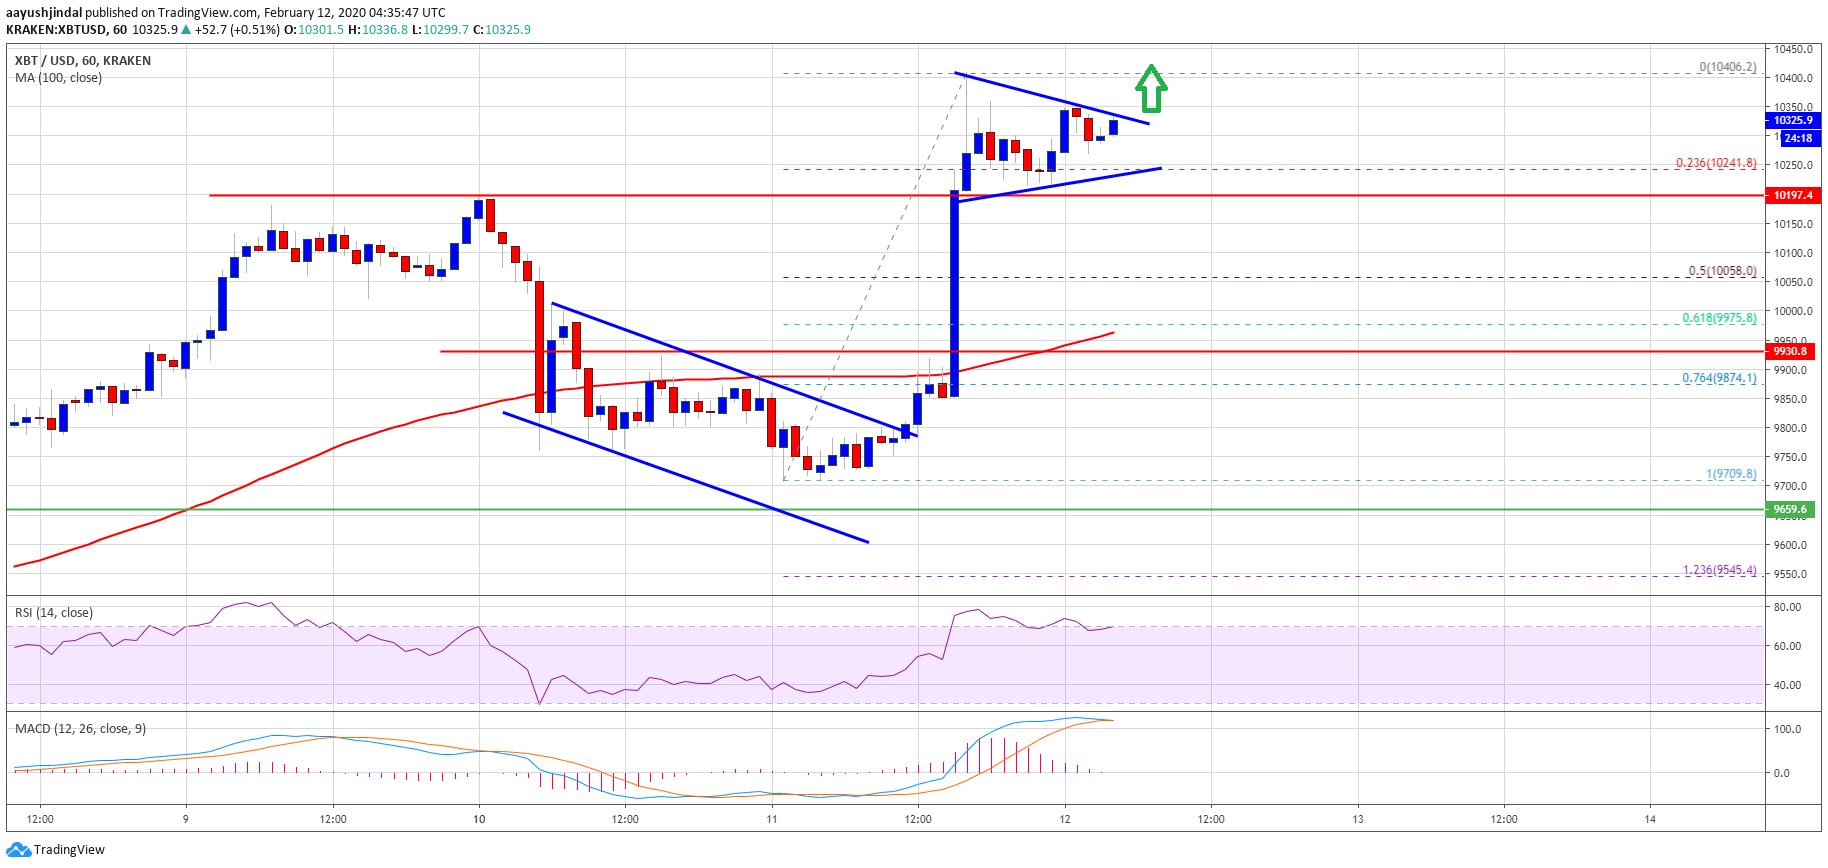
It opened the doors for more gains above the $10,000 barrier. Finally, bitcoin rallied above the $10,200 resistance and traded to a new 2020 high at $10,406. It is currently correcting gains below $10,350.
It tested the 23.6% Fib retracement level of the recent surge from the $9,709 low to $10,406 high. However, the price remained well bid above the $10,200 level. More importantly, there is a bullish continuation pattern forming with resistance near $10,385 on the hourly chart of the BTC/USD pair.
A clear break above the triangle resistance and $10,400 could accelerate gains in the coming sessions. The next resistance is near $10,500, above which the price is likely to surge towards the $10,800 and $11,000 levels.
Dips Remain Supported
On the downside, there are many supports forming near the $10,200 level. If bitcoin starts another correction below $10,200, it could slide towards the $10,050 support area.
The 50% Fib retracement level of the recent surge from the $9,709 low to $10,406 high is near the $10,050 level to act as a decent support. The next major support is seen near the $9,970 level since it is close to the 100 hourly simple moving average. Any further losses may perhaps start a strong decline towards $9,500.
Technical indicators:
Hourly MACD – The MACD is now gaining momentum in the bullish zone.
Hourly RSI (Relative Strength Index) – The RSI for BTC/USD is rising and it is well above the 65 level.
Major Support Levels – $10,200 followed by $10,050.
Major Resistance Levels – $10,400, $10,500 and $11,000.

