The views and opinions expressed here are solely those of the author and do not necessarily reflect the views of Cointelegraph. Every investment and trading move involves risk, you should conduct your own research when making a decision.
Market data provided by HitBTC exchange.
While markets have looked bullish this week following a sharp surge May 3, traders need to watch out for a correction in the next few days. This pullback will shake out the weak hands and will differentiate between different digital currencies. While some will lose only a part of their recent gains, others will plunge towards their lows again.
The stronger ones are likely to lead the next bull market in cryptocurrencies. Therefore, traders should buy strength after the pullback ends. If our assumption is correct, the current fall should offer a great opportunity to buy for the long-term. Our view will be invalidated if cryptocurrencies give up all the gains made over the past few weeks.
A survey by financial consultancy firm DeVere Group shows that 68% of high-net-worth individuals across the globe will have invested in cryptocurrencies by the end of 2022. One of the major reasons for investing in cryptocurrency is their borderless nature, which makes the assets available across the globe.
ATOM/USD
Atom (ATOM), the native crypto asset of the Cosmos blockchain, made an impressive start as it made a place for itself among the top 15 cryptocurrencies by market capitalization within a very short span of time. Its price received a boost as it was listed on Binance, without even trying. However, while the initial response has been bullish, can the momentum continue in the best performing major cryptocurrency of the past week or is it time to take some chips off the table? Let’s take a look.
The ATOM/USD pair has a very short trading history; hence, we are using a daily time frame chart on it. The pair witnessed huge volatility on its listing day. From a high of $8.90 on April 22, it plunged to a low of $2.9277 on April 24. That was a drop of 67.10%. However, since then, the recovery has been sharp. The price has reached close to the 38.20% Fibonacci retracement of the recent fall. A rally above this resistance can push the price to $5.9139, which is the 50% retracement level.
The level between $5.9139 to $6.6186 will act as a stiff resistance. Any breakout of the 61.80% Fibonacci retracement can propel the digital currency to $8.90. However, if the price turns down from the current levels, it can drop to the next support of $3.60.
DASH/USD
The recovery in market prices pushed the mining hashrate of Dash (DASH) to an all-time high of 3.2385 petahashes on April 19, bettering its previous record of 3.237 petahashes set in early November 2018. It has since then again improved on the record to 3.8957 petahashes on May 2.
In order to solve the issues faced by Dash merchants, Dash Retail has released a merchant transaction counter for its point-of-sale app and a conversion rates API to provide accurate conversion rates to fiat currencies.
The DASH/USD pair corrected to the breakout level of the range in the week before this past one. We like that the price has sustained above the 20-week EMA since breaking out of it. The bulls are currently attempting to resume the recovery. It will pick up momentum after it breaks out of the overhead resistance between $138.709 and the 50-week SMA. Above this zone, the pair can rally to $225.
On the other hand, if the digital currency reverses direction and plunges below $103.261, it will re-enter the range. This will weaken it and can result in a fall to the yearly low.
MIOTA/USD
Car manufacturer Jaguar Land Rover will reward drivers by giving them MIOTA tokens for data reporting. These tokens can thereafter be redeemed for various products. The Austin Transportation department in the city of Austin, Texas has collaborated with Iota Foundation to work towards a more interoperable transportation ecosystem.

The MIOTA/USD pair has been range bound between $0.244553 and $0.385033 since the end of December last year. The bears attempted a breakdown of this support in the week before but failed. Buyers quickly pushed the price back in the range. However, the pair is facing resistance at the 20-week EMA. If the price can scale above this resistance, it will challenge the top of the range at $0.385033.
A breakout of the range is likely to start a new uptrend that can carry the price to the psychological resistance of $0.50. On the other hand, a breakdown below $0.244553 will sink it to lows. The longer the digital currency remains in the range, the stronger its eventual breakout will be.
BTC/USD
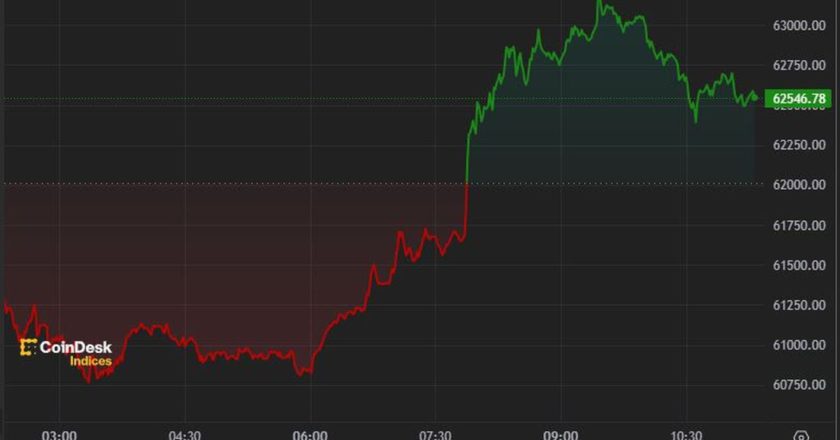
Bitcoin (BTC) prices have risen sharply over the past seven days. Fundstrat analyst Robert Sluymer believes that this is the start of a new uptrend and investors should buy more on any pullback. He expects the price to zoom past $6,000 in the second half of the year.
It is interesting to note that bitcoin’s dominance has increased from about 50% to 55.5% in about a month. This shows that traders are currently favoring bitcoin over other altcoins. More and more people are now aware of Bitcoin and about 11% of the American population has already invested in it, according to a survey by Spencer Bogart of Blockchain Capital.
Grayscale Investments has started a “Drop Gold” campaign where it portrays BTC as an alternative to gold investments. With all these bullish noises, should one buy now or wait?

The BTC/USD pair has reached the stiff overhead resistance of $5,900. This is a critical level because the pair had repeatedly taken support close to it since February to early November, before breaking below it. Now on the way up, we expect a lot of supply to hit around these levels.
But the price has risen above both moving averages, which is a positive sign. If the bulls can continue the momentum and ascend $5,900, the digital currency can rally to $6,480.54. We do not expect the zone between $6,000 to $6,480.54 to be crossed in a hurry. A minor correction or a consolidation around these levels is likely.
On the downside, support is at $4,914.11. If this level breaks, it will dampen sentiment and can drag the price to the next support at $4,255. Traders who have missed out buying in this recovery can wait for dips to buy, instead of chasing the rally.
BCH/USD
The next hard fork on bitcoin cash (BCH) is slated for May 15. Schnorr signatures, a scaling and privacy code change, will go live on the coin’s mainnet to improve the cryptocurrency’s privacy and scalability.

Since the surge in early April, the BCH/USD pair has largely been consolidating between $255 and $335.62. The attempt by the bears to plummet below this range in the last week found buyers at the 20-week EMA. Currently, the bulls are attempting to push the price towards the top of the range.
If the pair breaks out of the range and the minor resistance at $363.30, it can rally to the 50-week SMA and above it to $600. The digital currency has a history of vertical rallies; hence, it is likely to surprise to the upside.
Our bullish view will be invalidated if the digital currency plunges below the support of the 20-week EMA. In such a case, a fall to $166.25 is probable.
Market data provided by HitBTC exchange. Charts for analysis provided by TradingView.