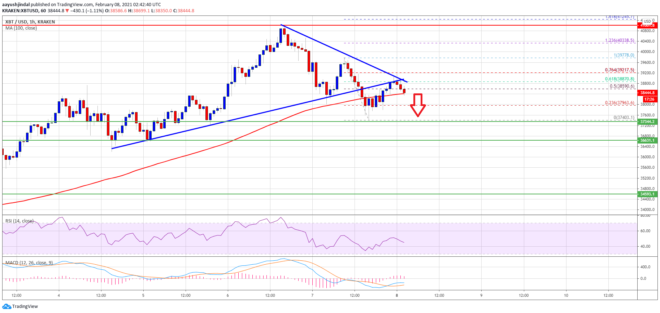
Bitcoin price started a downside correction from the $41,000 zone against the US Dollar. BTC is struggling to stay above $38,000 and it is likely to continue lower.
- Bitcoin failed to stay above the $40,000 pivot level and started a fresh decline.
- The price is struggling to stay above $38,000 and the 100 hourly simple moving average.
- There was a break below a key bullish trend line with support near $38,550 on the hourly chart of the BTC/USD pair (data feed from Kraken).
- The pair is likely to continue lower unless there is a strong move above $39,200.
Bitcoin Price is Showing Bearish Signs
After trading above the $40,000 level, bitcoin price failed to extend gains. BTC traded close to $41,000 and recently started a fresh decline. There was a break below the $40,000 and $39,200 support levels.
The price even spiked below the $38,600 support level and the 100 hourly simple moving average. There was also a break below a key bullish trend line with support near $38,550 on the hourly chart of the BTC/USD pair.
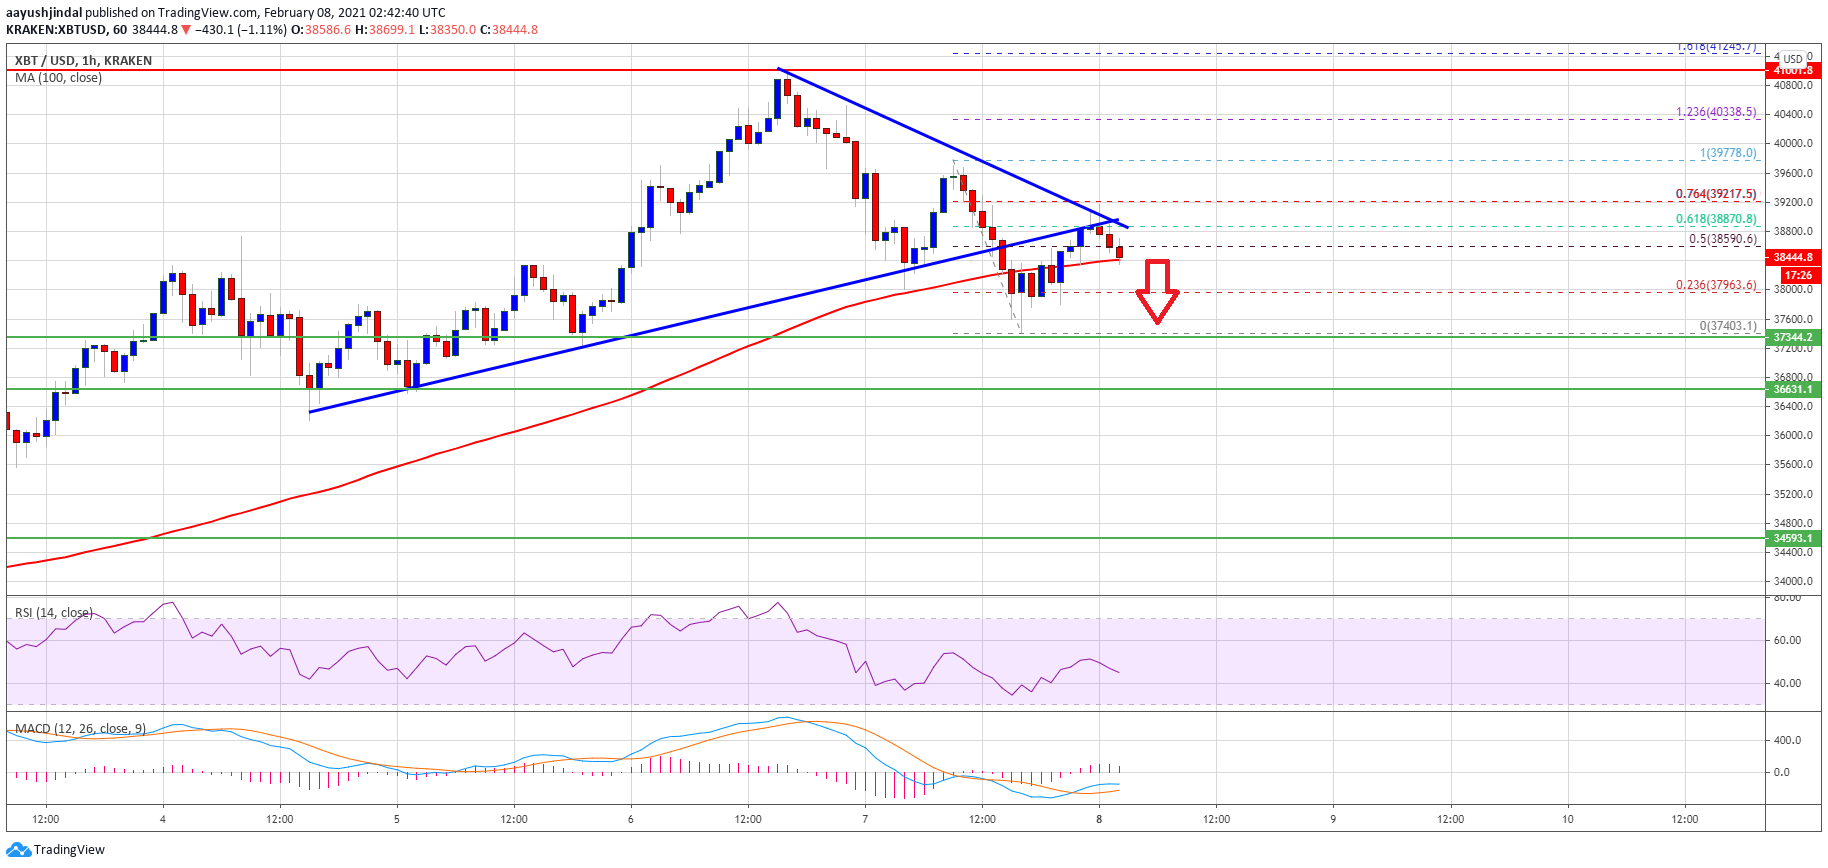
Source: BTCUSD on TradingView.com
A low is formed near the $37,400 level and the price is currently recovering. It corrected above the 50% Fib retracement level recent decline from the $39,778 swing high to $37,403 low. It is now struggling to stay above $38,000 and the 100 hourly simple moving average.
There is also a connecting bearish trend line forming with resistance near $38,880 on the same chart. The trend line is close to the 61.8% Fib retracement level recent decline from the $39,778 swing high to $37,403 low.
If there is an upside break above the trend line resistance, the price could start a decent recovery towards $40,000. Conversely, bitcoin price might resume its slide below $38,000. The next key support is near the $37,400 level, below which the price could dive towards the $36,000 support zone.
Fresh Increase in BTC?
If bitcoin manages to stay above $38,000 or $37,500, it could start a fresh increase. An initial resistance is near the $38,800 zone and the bearish trend line.
A clear break above the trend line resistance, and then a follow up move above $39,200 may possibly start a steady increase in the coming sessions.
Technical indicators:
Hourly MACD – The MACD is gaining momentum in the bearish zone.
Hourly RSI (Relative Strength Index) – The RSI for BTC/USD is now well below the 50 level.
Major Support Levels – $38,000, followed by $37,500.
Major Resistance Levels – $38,800, $39,200 and $40,000.