Latest Ripple News
Considering prevailing market conditions, it is clear that it has been a tough week for market participants. With double digit losses and breaks below important support levels, the meltdown was—and continues to be unforgiving. But even as participants despair, XRP did emerge as the winner of the “store of value” race edging Bitcoin and flipping Ethereum as the second most valuable coin in the space.
Read: The Crypto Bubble Hasn’t Burst, It Hasn’t Even Begun Yet
Ethereum is teetering and as the gap widen, mainstream hopium is that XRP would soon replace Bitcoin at the mantle. From our price charts, XRP is down 17 percent in the last week and as a safe harbor during this storm, the expanding number of partnerships, the zeal of the community advocating for “base” at Binance and on-chain technological advancement as the launch of xRapid and xVia to complement xCurrent is giving it a foothold in the space.
The xrp base shill is strong. Let’s get it out of your system, and put all your shills under this one tweet, and let’s see how much we get. https://t.co/usiISCtuSj
— CZ Binance (@cz_binance) November 18, 2018
Interesting Read: Edward Snowden Bullish On Crypto: Blockchain Money Makes Sense
Of course, this is a step in the right direction for a platform that draws it value from offering banks solutions that help them move funds faster, cheaply and more efficiently. Ripple’s aim is to create this maze of banks, the internet of value allowing for instantaneous movement of funds.
XRP/USD Price Analysis
Weekly Chart
Even though losses are sharp as bears press the sell pedal, XRP/USD is technically bullish. It is our expectations that price shall print higher by close of 2018. It’s easy to see why. In an effort versus result scenario, bulls are obviously shoring prices.
Note that in the midst of marauding bears, XRP/USD is yet to print below 25 cents for a complete reversal of week ending Sep 23 gains. As a matter of fact, prices are trading above 35 cents-40 cents support zone. As long as it remains that way, traders can begin picking up longs in lower time frames with targets at 80 cents or higher.
This preview shall no longer be valid if losses extend below 35 cents. In that case sellers would most likely drive prices below 25 cents towards 15 cents or lower.
Daily Chart
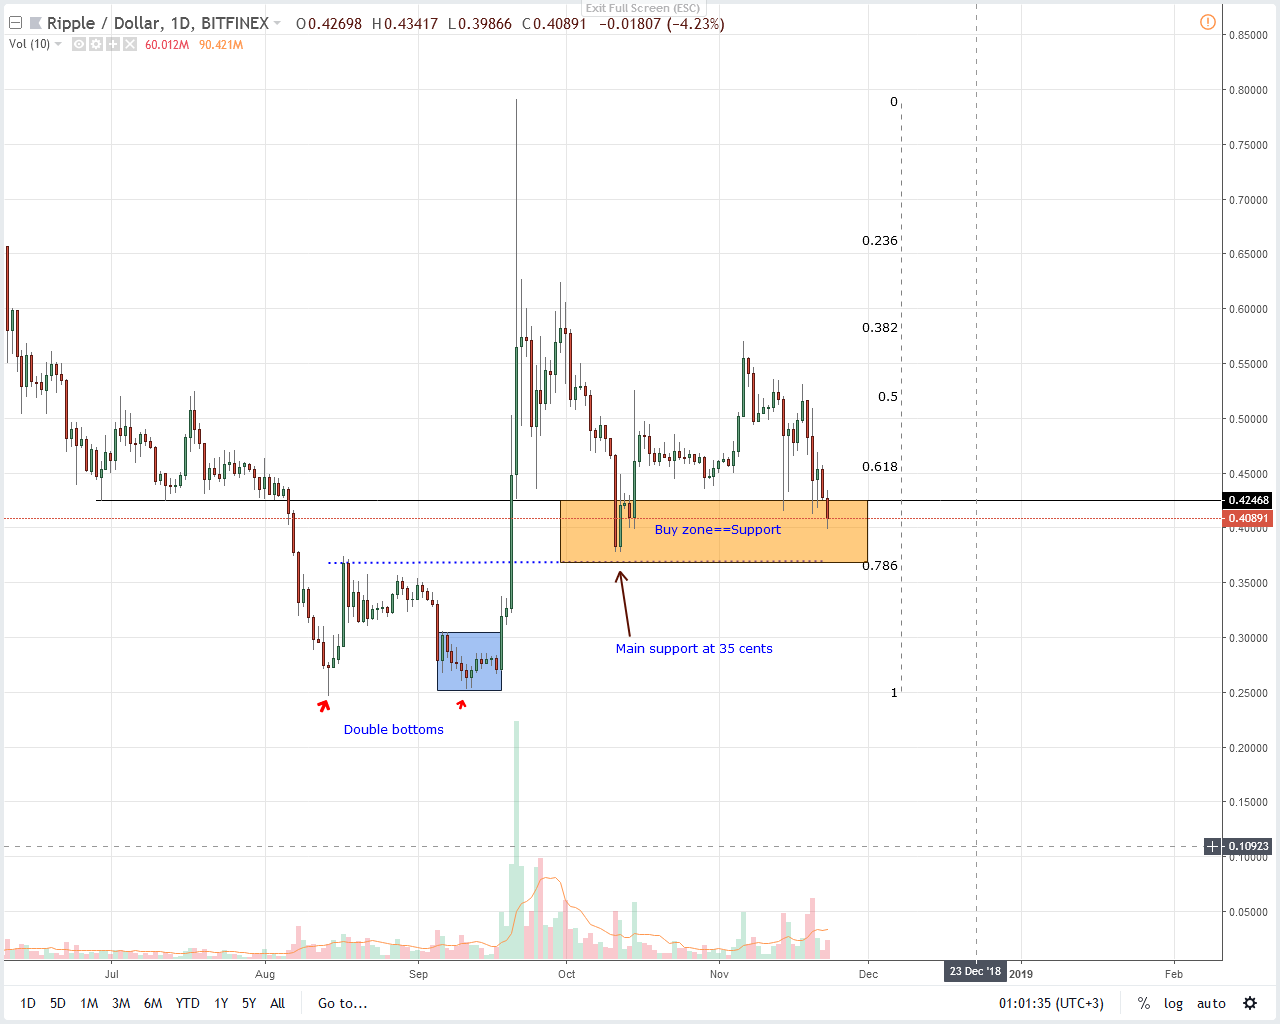
As it is XRP/USD is now trading within our ideal buy zone set between the 78.6 percent and 38.2 percent Fibonacci retracement zones. In line with our XRP/USD trade plan, we suggest aggressive traders to buy at spot prices with stops at 35 cents—the 78.6 percent Fibonacci retracement level with first targets at Sep 2018 highs of 80 cents.
On the other hand, conservative traders should wait for strong gains above the 60 cents before buying on dips with targets at $1.65. Conversely, dips below 35 cents cancel this preview. In that case, aggressive traders ought to sell at spot with stops at the highs of that breakout bar as they aim for 15 cents.
All Charts Courtesy of Trading View
Disclaimer: Views and opinions expressed are those of the author and aren’t investment advice. Trading of any form involves risk and so do your due diligence before making a trading decision.