The views and opinions expressed here are solely those of the author and do not necessarily reflect the views of Cointelegraph.com. Every investment and trading move involves risk, you should conduct your own research when making a decision.
The market data is provided by the HitBTC exchange.
Google searches for Bitcoin tripled as its price skyrocketed on Apr. 02. This shows that interest in cryptocurrencies is still high. If prices recover, a large number of traders sitting on the sidelines will jump onto the crypto bandwagon.
Though the rebound is a bullish sign, for it to be sustainable, Bitcoin needs to gain a wider adoption in day to day transactions. Andreas Antonopoulos, Bitcoin educator and entrepreneur, believes that the next generation of use cases will highlight the need of Bitcoin to the average customer. Bitcoin is currently limited only to the tech-savvy users due to the difficulty in transaction and storage. But with advances, it is likely to reach the masses that will increase its popularity.
In a report, software startup DataLight said that if Bitcoin continues to grow exponentially, the way it has in the past decade, then it will surpass the current leaders Visa, Master Card, and pay pal. While fundamentals determine the price in the long-term, short-term price is influenced by sentiment. Let’s analyze it with the help of charts.
BTC/USD
We had been projecting a target objective of $5,273.91 on Bitcoin (BTC) for the past few days and on Apr. 02, it hit an intraday high of $5,273.35. However, the higher levels saw profit booking that dragged the price back towards the support of $4,914.11. On the downside, $4,775 provided support, which is a positive sign. This shows that the bulls are in no great urgency to book profits.
The BTC/USD pair is again attempting to resume the up move. If it scales above $5,273.35, a quick rally to $5,674 and above it to $5,900 is possible. Therefore, we had recommended to book only partial profits in our previous analysis. However, with the RSI deep in the overbought territory, the pair might spend some more time in consolidation close to the current levels.
Our bullish view will be invalidated if the digital currency turns down from the current levels and slides below $4,500. Therefore, traders can raise the stops on the remaining long positions to $4,400.
ETH/USD
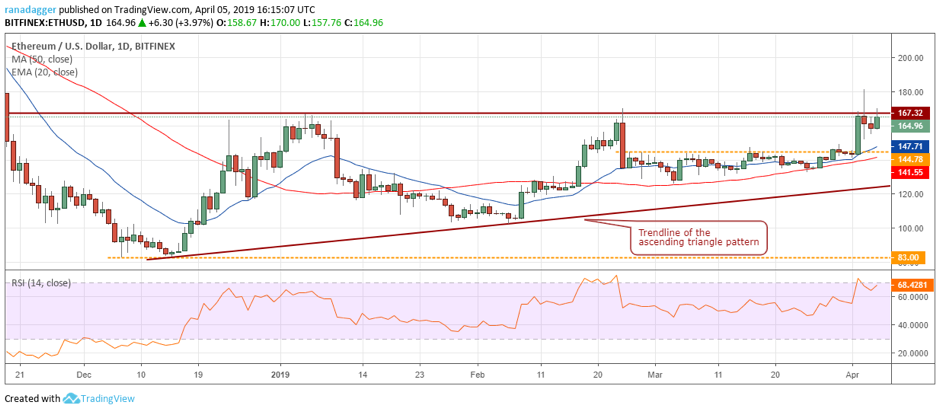
Ethereum (ETH) could not close (UTC time frame) above $167.32 on Apr. 03. This shows selling at higher levels. However, the pullback found support close to $150 levels.
Currently, the bulls are again attempting to scale above the resistance of $167.32. If successful, the ETH/USD pair will complete a bullish ascending triangle pattern that has a target objective of $251.64.
Contrary to our assumption, if the digital currency reverses direction from the current levels and plummets below $144.78, it can fall to the trendline of the ascending triangle. Traders can trail the stop loss on the remaining long position to $150.
XRP/USD
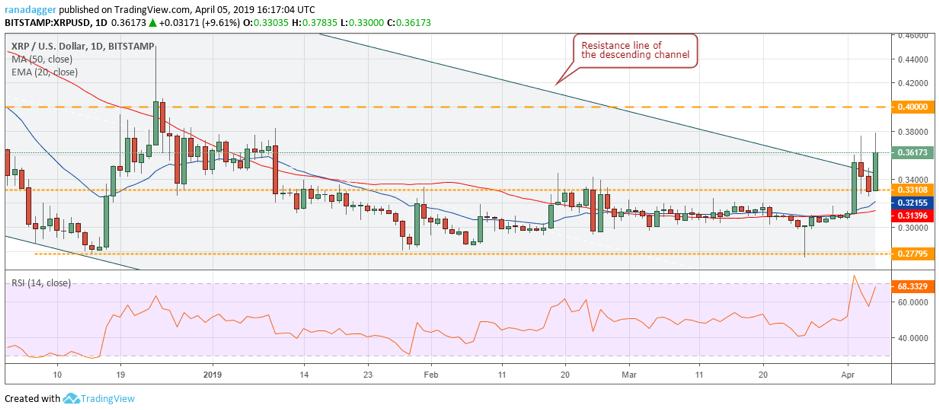
As expected, Ripple (XRP) pulled back to the breakout level on Apr. 02 and 03, which held. This is a positive sign. Currently, the price has bounced off the support and is on its way towards the first target objective of $0.40.
If the price sustains above the resistance line of the channel, it will signal the end of the downtrend. In the medium-term, the XRP/USD pair is likely to reach $0.60. Our bullish view will be invalidated if the pair slumps back below $0.33108. It will indicate a lack of demand at higher levels. We shall wait for the price to sustain above the channel for a couple of days before recommending any long positions.
LTC/USD
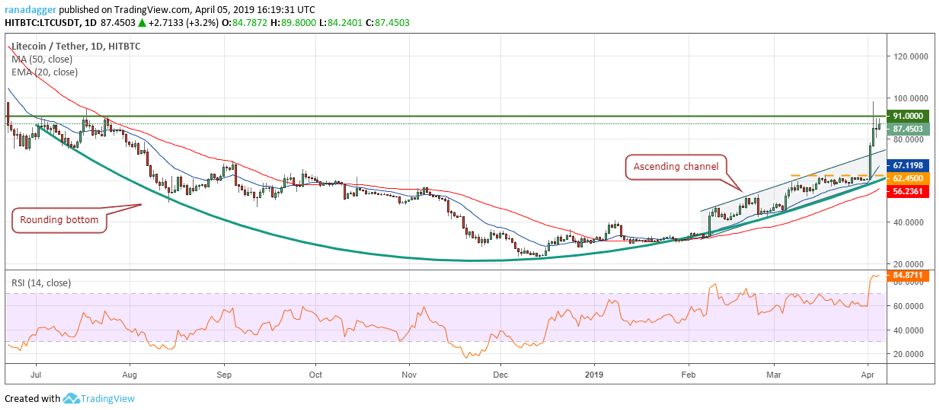
Litecoin (LTC) broke out of the overhead resistance at $91 on Apr. 03 but faced profit booking close to $100 levels. We expect $91 to act as a stiff resistance. The RSI had risen deep into the overbought territory, hence, we had proposed traders close their complete long positions in the previous analysis.
The pullback in the LTC/USD pair took support at $80.4193 and is currently again trying to breakout of $91. If the pair breaks out and sustains above $91, it will be on target to reach $159. Nevertheless, if the bears defend the overhead resistance, a fall to $77 is probable. We shall wait for another buy setup to form before suggesting long positions once again.
BCH/USD
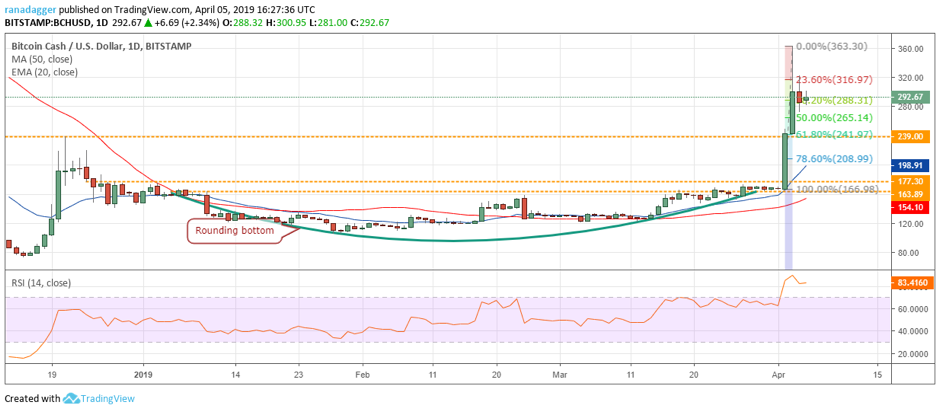
Bitcoin Cash (BCH) soared to $363.30 level on Apr. 03, coming close to our target objective of $400. But higher levels attracted profit booking and the digital currency has given up some of its recent gains since then.
After rallying 117.57 percent in two days, the BCH/USD pair might consolidate or correct for a few days before attempting to rise to $400 once again. Support on the downside is at $265.14 and $241.97, being 50 percent and 61.8 percent Fibonacci retracement levels of the recent rally.
If the bears sink the price below $239, a fall to $208.99 and below it a full 100 percent retracement to $166.98 is probable. Therefore, traders can trail the stop loss on the remaining long positions to $230.
EOS/USD
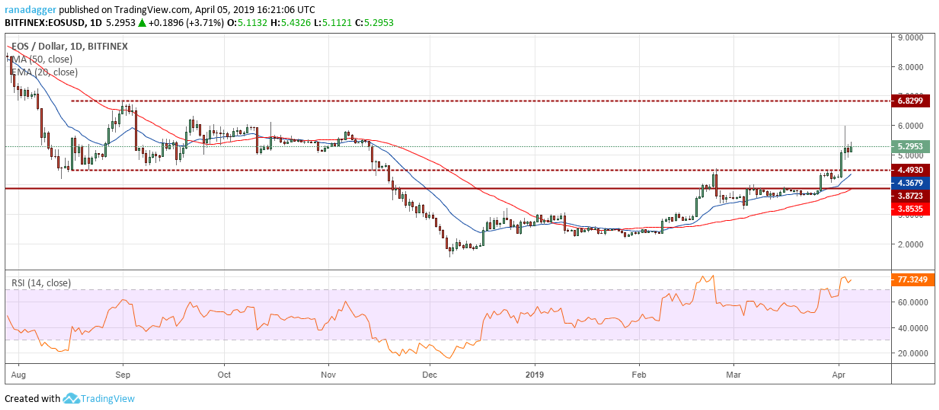
EOS reached our target objective of $5.8370 on Apr. 03 but it could not sustain the higher levels. The ensuing pullback found support at $4.90. Currently, the bulls are again attempting to push the price back above $6 and towards the next target objective of $6.8299. The moving averages are sloping up and the RSI is in the overbought zone, which shows that the bulls are in the driver’s seat.
On the downside, any pullback might find support close to $4.4930, which is the previous resistance turned support. The 20-day EMA is also located just below this level. Hence, we expect the buyers to defend this level with force. If the level holds, the EOS/USD pair might remain range bound between $4.49 to $6.8299 for a few more days. But if this level breaks, it will indicate weakness. Traders can trail the stops on the remaining long positions to $4.8. We suggest tightening the stop loss to protect our paper profits.
BNB/USD
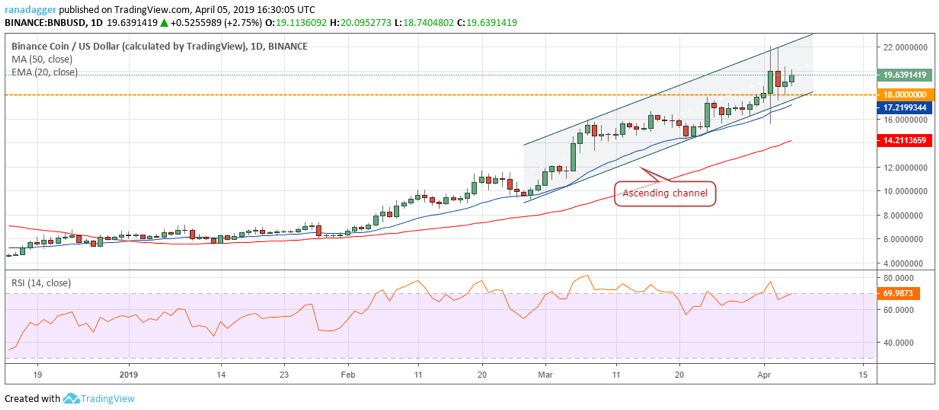
Binance Coin (BNB) is consolidating above $18 for the past two days, which is a positive sign. After the range expansion on Apr. 02, the range has shrunk for the past two days. The digital currency is taking a break after its stupendous run in the past few days.
If the bulls scale above the overhead resistance at $22, a retest of the lifetime highs at $26.4732350 will be on the cards. The digital currency remains in a strong uptrend with both the moving averages sloping up and the RSI close to the overbought levels. Traders can continue to trail the stops on the remaining long positions to just below the 20-day EMA.
The BNB/USD pair is currently trading inside the ascending channel. A breakdown of the channel and the 20-day EMA will be the first indication that the momentum is losing steam. A break below Apr. 02 intraday low of $15.5624721 can attract further selling and drag the price to the 50-day SMA. If this level also breaks, the trend will turn in favor of the bears.
XLM/USD
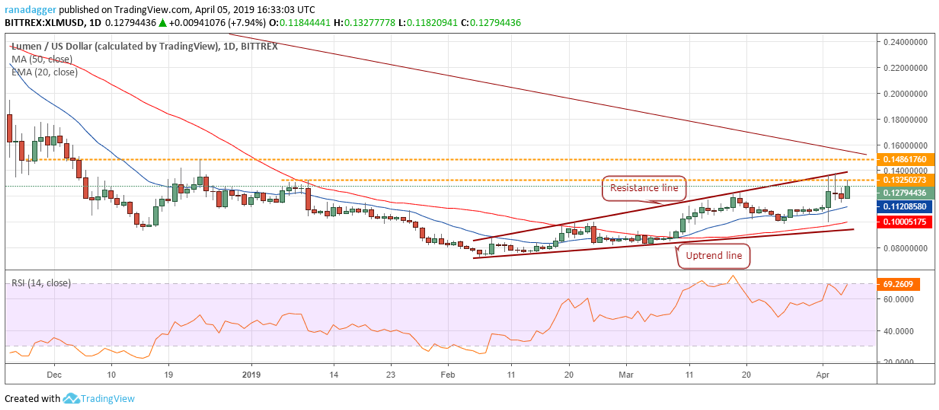
Stellar (XLM) is struggling to scale above the resistance line. The price turned down from the resistance on Apr. 03 but found support just above the 20-day EMA. Traders would have closed partial long positions as suggested in our previous analysis.
If the bulls succeed in breaking out of the overhead resistance, a rally to $0.14861760 is probable. This might act as a stiff resistance because the long-term downtrend line is also located just above this level. On the downside, the 20-day EMA will act as a strong support. Both the moving averages are trending up gradually and the RSI is close to the overbought zone. This shows that the bulls are in command. If the XLM/USD pair scales above the downtrend line, it might signal the end of this downtrend. Traders can keep the stops on the remaining position at breakeven.
ADA/USD
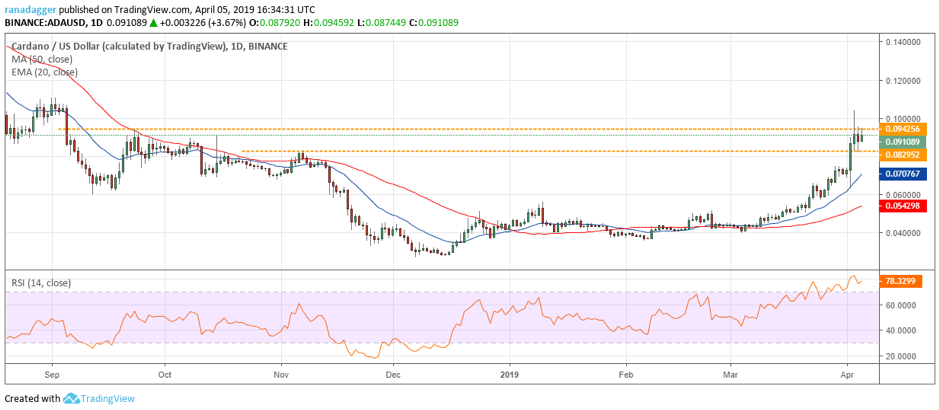
Cardano (ADA) witnessed profit booking above $0.094256 levels on Mar. 03, It fell to $0.081791 on the next day but quickly bounced back, which shows buying on dips. Currently, the bulls are attempting to push the digital currency above the overhead resistance once again.
If successful, a rally to $0.112598 is probable. Above this level, there is no major resistance until $0.20. We suggest traders trail the stop loss on the remaining long positions to $0.080.
The trend remains up with both the moving averages sloping up and the RSI in the overbought zone. But after the sharp rally, a pullback or a consolidation cannot be ruled out. The ADA/USD pair will enter a correction if the price plummets below $0.081791. The first support on the downside is at the 20-day EMA, which is likely to hold. Traders should look to buy on dips as long as the trend remains up.
TRX/USD
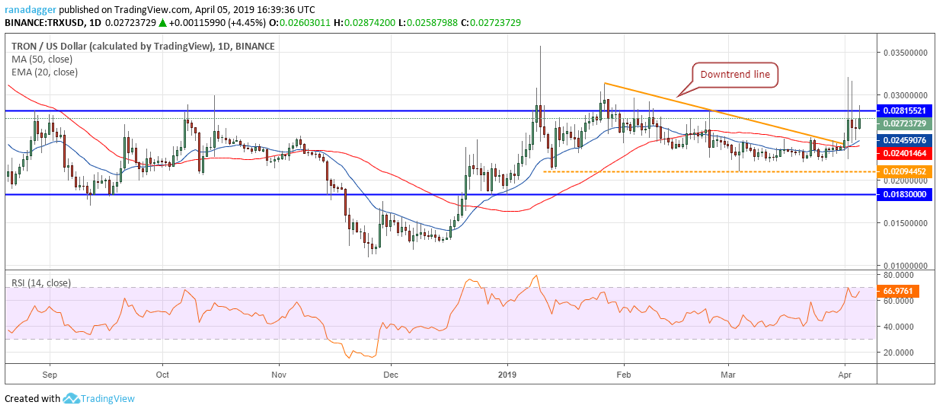
Tron (TRX) could not sustain the breakout above $0.02815521 on Mar. 02 and 03. However, on the downside, it took support at the 20-day EMA, which is a positive sign. Currently, the bulls are attempting to breakout of the overhead resistance once again. If successful, it is likely to start a new uptrend. Therefore, traders can wait for a breakout and close (UTC time frame) above $0.02815521 to initiate long positions. The stop loss can be kept at $0.024, which can be raised later.
The first target on the upside is $0.040. If this level is crossed, the rally can extend to $0.0480. With the 20-day EMA starting to slope up and the RSI close to the overbought zone, the path of least resistance is to the upside.
Our bullish view will be invalidated if the TRX/USD pair again fails to sustain above $0.02815521 and plummets below the moving averages.
The market data is provided by the HitBTC exchange. The charts for the analysis are provided by TradingView.


