The bitcoin price failed to extend its bounce once again, weighed down by weak bulls.
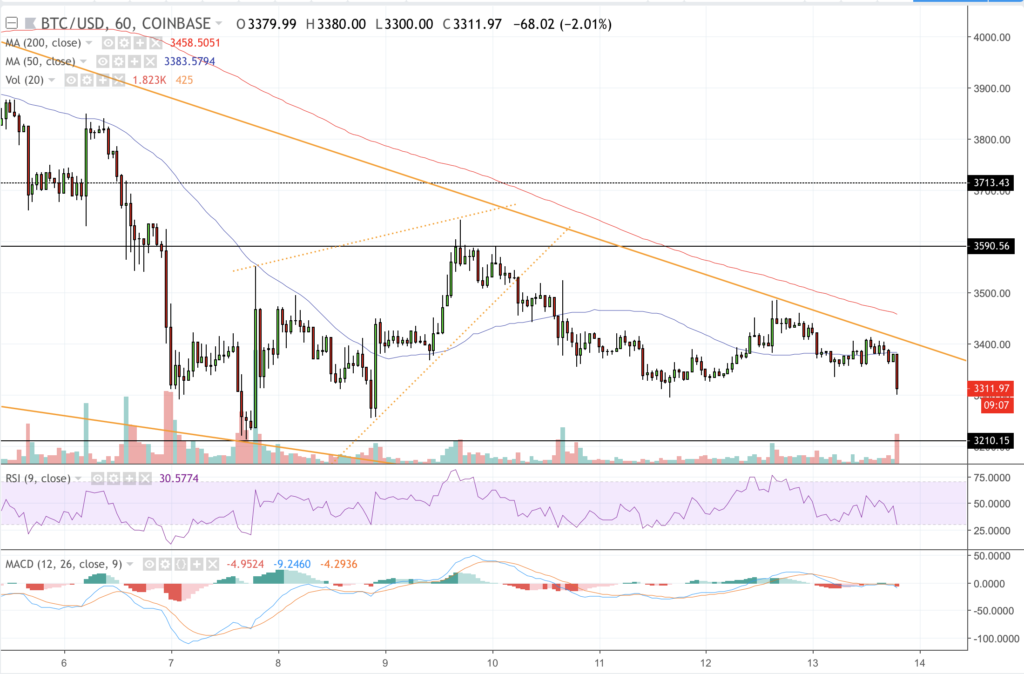
The BTC/USD rate on Thursday dropped as low as 5.38 percent from its intraday high at 3488-fiat. The pair at press time is forming lower lows towards 3300-fiat on a strong volume jump on Coinbase. It expects to extend its downside momentum even further, with the near-term momentum readings clearly entering inside the oversold area. A weak support wall is lingering at 3295-fiat which, if broken, would confirm a drop towards the 3210-3250-fiat area.

The US Dollar index is looking stronger on Thursday, specifically against commodities like gold. The speculation over the outcome of an upcoming Federal Reserve‘s monetary policy meeting is directly impacting the dollar’s behavior. Whether or not the Fed will increase the interest rates is on the agenda, and a tighter rate policy could benefit gold — as well as bitcoin — in the long-term.
BTC/USD Long-Term Indicators

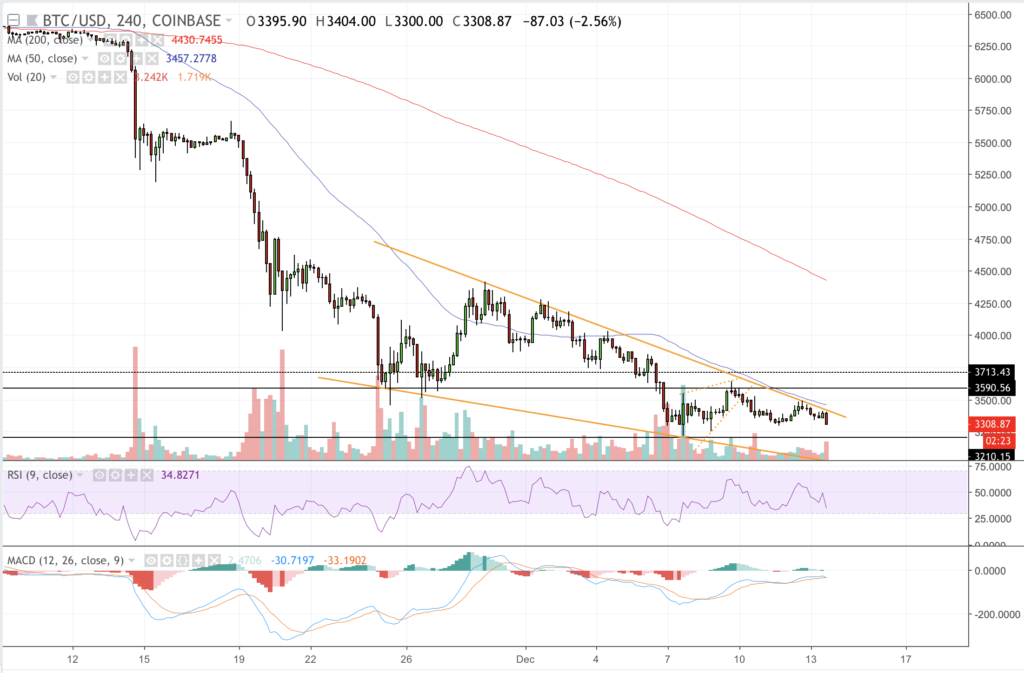
We speculated on a falling wedge formation yesterday for a potential breakout, but that didn’t happen. We had also discussed a trend reversal scenario, which happened. As of now, we are looking at the same falling wedge pattern as bitcoin hints an extended selling action.
Ideally, the BTC/USD pair could break below its 2018’s low at 3210-fiat to test 3000-fiat as the long-term support — or bottom. The lower area should provide bulls enough opportunities to attempt a strong bounce back, again towards the upper trendline of the falling wedge formation, depicted in orange. In another case, the pair should keep falling, even below 3000-fiat, to look for a bottom towards 1500-2000-fiat area, as predicted by other analysts.
The RSI momentum indicator is reading a strong selling sentiment on daily charts. The MACD indicator is also trending inside a negative area. That said, the bitcoin market would likely be the same — strongly bearish.
BTC/USD Intraday Readings

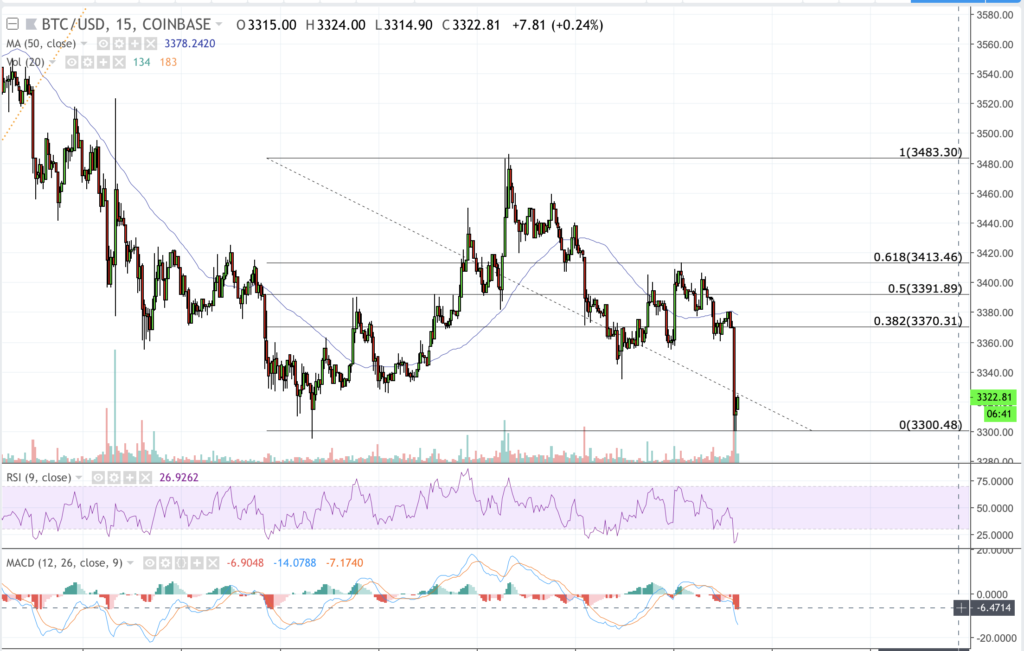
The latest drop has stopped weakly at 3300-fiat, which now serves as interim support level to day traders. To the upside, 3370-fiat is looking like a reasonable interim resistance, given its history of being one during the Tuesday trading session.
We are pretty much entering our initial positions inside the said range. A weak bounce back has allowed us to enter a long position towards 3370-fiat. Considering the low volume the bounce is exhibiting, we have also opened a stop loss order at 3290-fiat to minimize our losses in the event of an extended selling action.
Having said that, an extended sell-off could have us switch to our breakdown strategy. It means that on a break below the interim support, we will open a short position towards 3210-fiat as our primary downside target. A stop loss would be placed just $10 above the entry position to maintain our risk management.
Featured Image from Shutterstock. Charts from TradingView.
Get Exclusive Crypto Analysis by Professional Traders and Investors on Hacked.com. Sign up now and get the first month for free. Click here.


