
Ripple is recovering above the $0.2450 resistance against the US Dollar. The current technical structure suggests XRP price is likely to surge above $0.2500 and $0.2550.
- Ripple is slowly gaining bullish momentum above the $0.2450 resistance against the US dollar.
- The price is trading near the $0.2500 resistance, but it is above the 100 hourly simple moving average.
- There is a key bullish trend line forming with support near $0.2470 on the hourly chart of the XRP/USD pair (data source from Kraken).
- The pair could accelerate higher if it clears the $0.2500 and $0.2550 resistance levels.
Ripple Price Likely To Accelerate Higher
In the past three sessions, there was a decent recovery in ripple above the $0.2400 level. XRP price broke the $0.2450 resistance level and the 100 hourly simple moving average to start the current recovery.
There was a break above the 50% Fib retracement level of key decline from the $0.2535 swing high to $0.2380 swing low. The price is now testing the $0.2480 and $0.2500 resistance levels.
The 76.4% Fib retracement level of key decline from the $0.2535 swing high to $0.2380 swing low is also near the $0.2500 level. More importantly, there is a key bullish trend line forming with support near $0.2470 on the hourly chart of the XRP/USD pair.
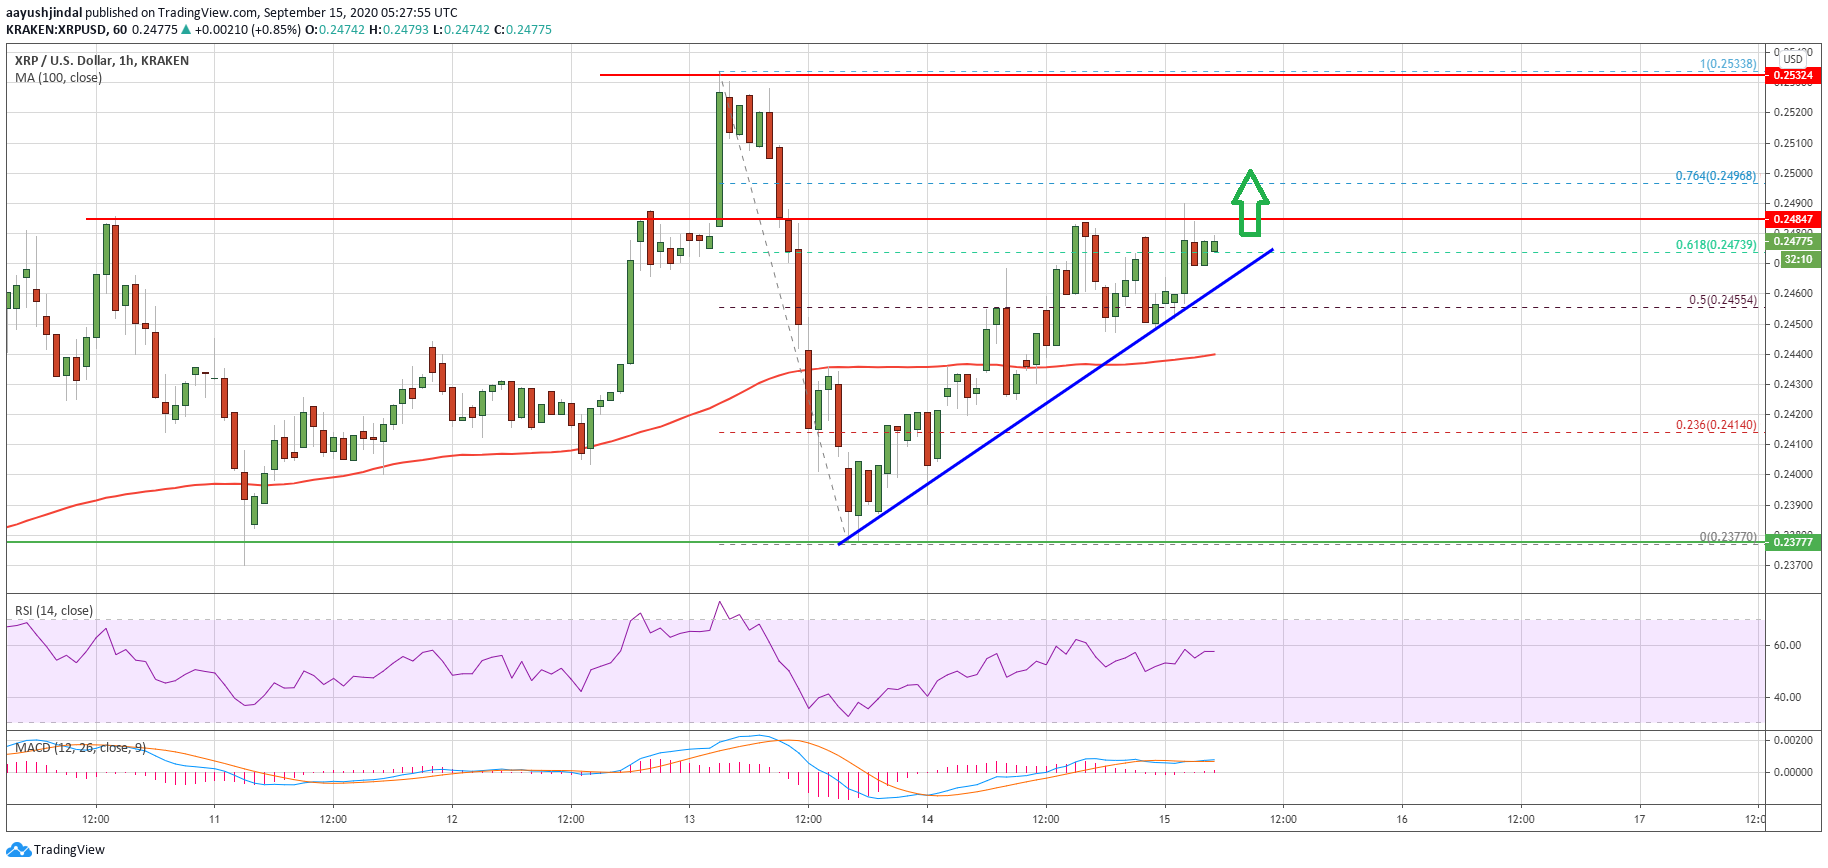
Ripple price trades above $0.2450. Source: TradingView.com
The current price action is positive, a close above the 100 hourly SMA, and the recent rise in bitcoin, bitcoin cash and ethereum are key reasons why ripple price might continue to rise above the $0.2480 and $0.2500 levels.
The next resistance is near the $0.2550 level. A successful close above the $0.2550 zone could open the doors for a strong rise towards the $0.2650 and $0.2700 resistance levels in the near term.
Another Failure in XRP?
If ripple fails to clear the $0.2480 and $0.2500 resistance levels, there could be a bearish reaction. An initial support on the downside is near the trend line at $0.2470.
The main support is forming near the $0.2440 level and the 100 hourly simple moving average. A downside break below the $0.2440 support and the 100 hourly simple moving average could lead the price towards the $0.2380 support zone in the near term.
Technical Indicators
Hourly MACD – The MACD for XRP/USD is slowly gaining momentum in the bullish zone.
Hourly RSI (Relative Strength Index) – The RSI for XRP/USD is currently well above the 50 level with positive signs.
Major Support Levels – $0.2470, $0.2440 and $0.2380.
Major Resistance Levels – $0.2480, $0.2500 and $0.2550.