

- Bitcoin price is up more than 5% and it broke the key $8,500 resistance against the US Dollar.
- The price is currently consolidating gains above the $8,500 and $8,400 support levels.
- There is a short term breakout pattern forming with support near $8,540 on the hourly chart of the BTC/USD pair (data feed from Kraken).
- The price is showing a lot of positive signs and it could continue to rise above $8,600 and $8,750.
Bitcoin price is back in a positive zone above $8,500 against the US Dollar. BTC could correct in the short term, but it remains well supported above $8,350.
Bitcoin Price Analysis
Yesterday, we saw a minor downside correction in BTC below the $8,200 support area against the US Dollar. We also discussed a possible bounce as long as the price holds the $8,000 support area and the 100 hourly simple moving average. The price did stay above $8,000 and recently started a strong upward move. It is up more than 5% and surpassed the $8,350 resistance. Moreover, there was a break above the key $8,500 resistance area.
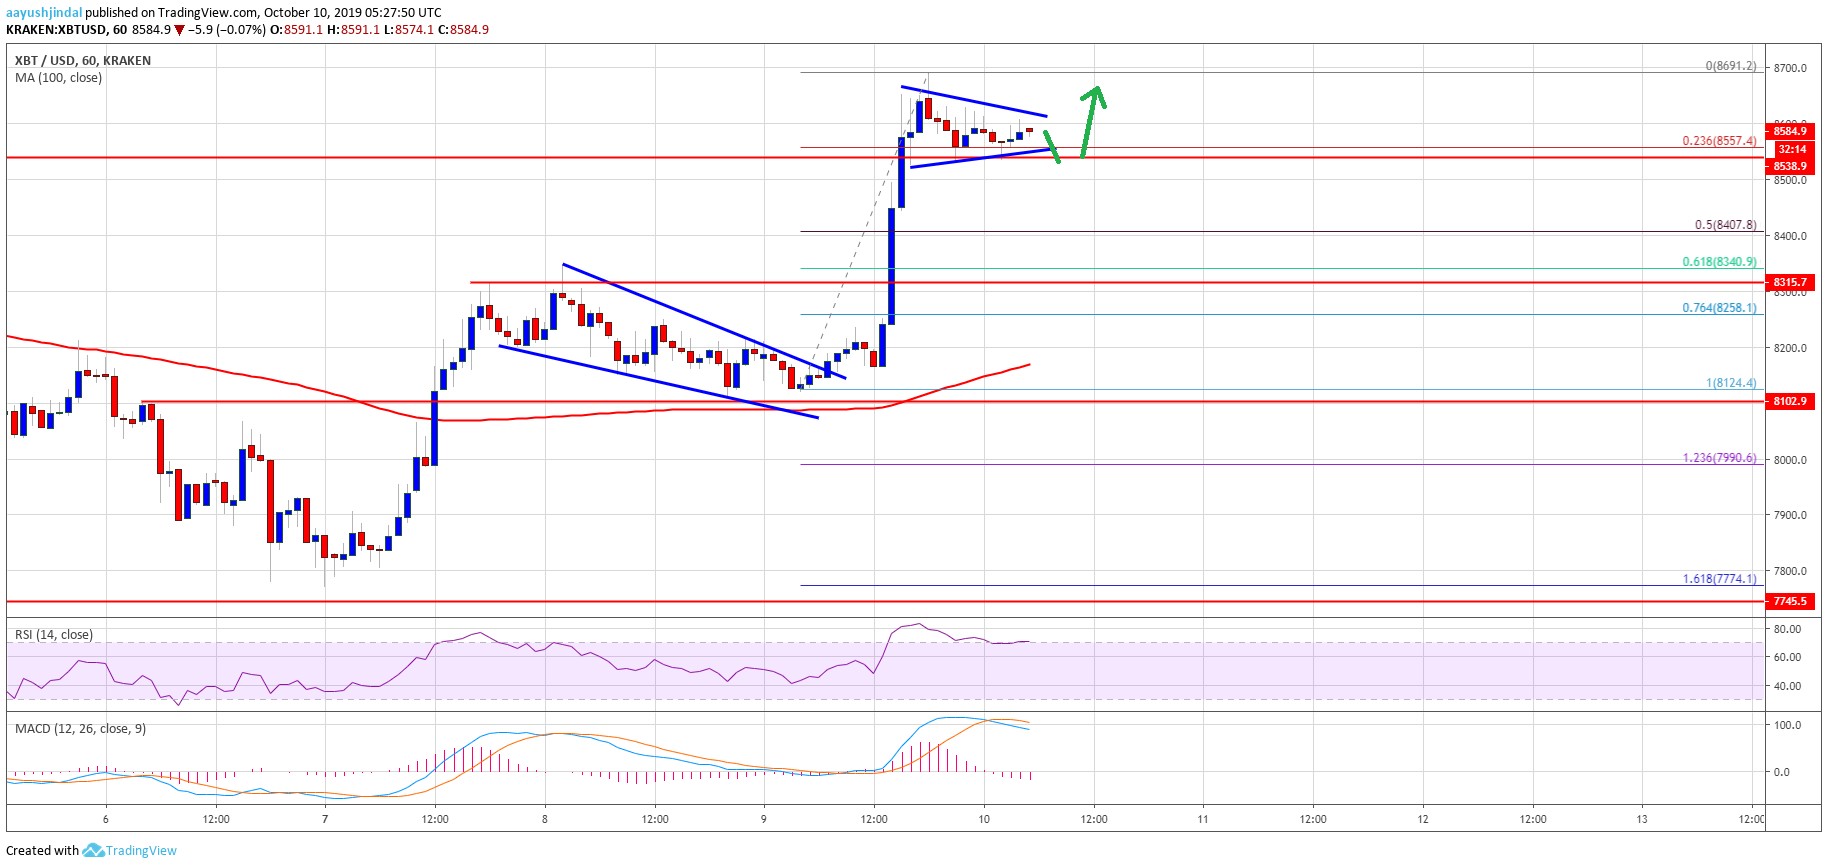
A new weekly high was formed near $8,691 and the price is currently consolidating gains. It corrected below the $8,600 level. However, the 23.6% Fib retracement level of the recent rally from the $8124 low to $8,691 high is acting as a decent support. Additionally, there is a short term breakout pattern forming with support near $8,540 on the hourly chart of the BTC/USD pair.
If there is a downside break below the $8,540 and $8,500 support levels, the price could extend its correction. The next key support is near the $8,400 level. Moreover, the 50% Fib retracement level of the recent rally from the $8124 low to $8,691 high is also near the $8,407 level. If there are any additional losses, the price may perhaps test the $8,350 support area (the recent key resistance).
The 61.8% Fib retracement level of the recent rally from the $8124 low to $8,691 high is also near the $8,340 level to provide support. On the upside, an immediate resistance is near the $8,620 level. If there is an upside break above $8,620 and $8,650, the price is likely to accelerate towards the $8,800 level.
Looking at the chart, bitcoin is clearly trading in a positive zone above the $8,500 pivot level. In the short term, there could be a downside correction, but the $8,400 and $8,350 levels are likely to protect losses.
Technical indicators:
Hourly MACD – The MACD is slowly moving in the bearish zone.
Hourly RSI (Relative Strength Index) – The RSI for BTC/USD is still well above the 60 level.
Major Support Levels – $8,540 followed by $8,400.
Major Resistance Levels – $8,620, $8,700 and $8,800.


