
View
- Bitcoin jumped to a five-week high of $4,100 earlier today, reinforcing the bullish view put forward by the recent bounce from the crucial 30-day moving average support. That, coupled with the flag breakout on the 4-hour chart, indicates scope for a re-test of $4,190 (February high).
- The short-term bullish case would weaken if prices fail to close today above $4,055 (March 21 high).
- On the downside, a bearish reversal would be confirmed if and when prices find acceptance below the 30-day moving average, currently at $3,900.
- Additionally, bitcoin’s 200-candle moving average (MA) on the three-day chart – a lagging indicator – is flatlined for the first time since early 2015. If history is any guide, then BTC could oscillate in the recent trading range of $3,100–$4,300 in the next few months before breaking into a bull market once the 200-candle MA begins trending south.
Bitcoin is slowly gaining altitude with a long-term lagging indicator flashing signs similar to those seen before the 2015 bull breakout.
The crypto market leader rose to $4,100 at 10:30 UTC on Bitstamp today – the highest level since Feb. 24 – validating a bullish higher low established along the crucial 30-day moving average (MA) support earlier this week.
Prices, therefore, could rise further toward the February high of $4,190 in the next few days. As of writing, BTC is changing hands at $4,075, representing 0.5 percent gain on a 24-hour basis.
While BTC’s short-term prospects seem to have improved with the move, a longer term bullish reversal above $4,236 still remains elusive.
A convincing break above that level, however, could happen in the next few months, according to historical data related to bitcoin’s three-day chart 200-candle moving average (MA). That average is based on two-year-old data and tends to lag price by more than a year.
For instance, bitcoin’s price topped out at $20,000 in December 2017 and has been charting lower highs ever since. The 200-candle MA, however, continued to trend north indicating a bullish setup throughout 2018 and shed the bullish bias (turned flat) this month – three months after price sell-off ran out of steam near $3,100.
A similar action was seen in months leading up to the long-term bullish reversal of October 2015, as seen in the chart below.
3-day chart
As seen above right, the 200-candle MA continued sloping upwards through the December 2013 to January 2015 bear market and turned flat in March/April 2015 – three months after the end of the sell-off at $152.
The cryptocurrency traded largely in the range of $200-$300 in the next six months before breaking into a bull run in October 2015.
It is worth noting that the average had begun trending south three months before the bull breakout.
If history is any guide, then BTC may spend the next few months in the recent trading range of $3,100–$4,300 and could pick up a strong bid once the key average starts trending lower.
Daily and 4-hour charts
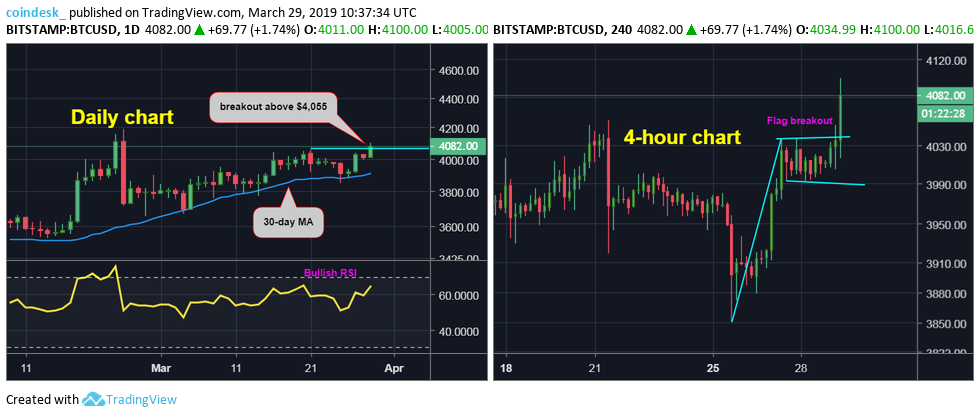
Bitcoin’s break above the March 21 high of $4,055 is accompanied by a bull flag breakout, a bullish continuation pattern, on the 4-hour chart (above right). Further, the 14-day relative strength index is reporting bullish conditions with an above 50.00 reading (see daily chart, left).
As a result, the February high of $4,190 could soon come into play. A longer-term bullish reversal would be confirmed if prices close above that level on Sunday.
The short-term bullish case, however, would weaken if prices fail to close above $4,055 today.
Disclosure: The author holds no cryptocurrency assets at the time of writing.
Bitcoin image via Shutterstock; charts by Trading View