
Bitcoin price may be trading sideways, but it continues to hold above a key level that in the past led to over 5,000% returns. BTCUSD has now held for its seventh consecutive weekly close above the Ichimoku cloud, but there’s a shocking twist coming that could shake up the sideways trend.
Bitcoin Price Closes Seventh Weekly Candle Above Ichimoku Cloud
The leading cryptocurrency by market cap has been consolidating below resistance for months now, preparing for its next major move. A rejection could potentially expose Bitcoin price to setting a new lower low, but a breakout above the current level could kick off a new bull market.
Because of the possible implications of the tight trading range breaking, crypto analysts are scouring through price charts hoping to make sense of the confusing price action.
Related Reading | This Unique Perspective on Bitcoin Charting Makes Bull Breakout Clear As Day
Some charting perspectives indicate a clear breakout and retest already, while other takes hint at something more bearish ahead.
Analysts are also relying on technical analysis indicators to help shed light on what to expect, and even that is cloudy. Bollinger Bands show the tightest contraction in years, something that typically precedes an over 50% or more movement. Weekly MACD is still bullish, as are other key indicators.
On the Ichimoku indicator, the market’s top crypto asset has been holding above the Kumo, or “cloud.” Bitcoin price candles have now closed above the Kumo for seven consecutive weeks. But what exactly does this mean or suggest?
BTCUSD Weekly Ichimoku | Source: TradingView
Avoiding Kumo Twist Reversal Could Result In New Crypto Bull Market, 5000% ROI
Although Bitcoin price has been holding strong above the Kumo, the cloud on the Ichimoku indicator is beginning to “twist.”
A “Kumo twist” can often be a sign of a reversal. In the image above, past Kumo twists clearly depict where and when reversals take place.
The Kumo grows or shrinks in size based on an asset’s relative volatility. When volatility drops, the Kumo thins and weakens, allowing price to pass through it like a hot knife through butter.
The twist in Kumo on BTCUSD weekly price charts may be hinting at a breakdown. In the image below comparing past Bitcoin price cycles with current price action, a breakdown was quickly bought back up once it touched the Kijun-Sen.
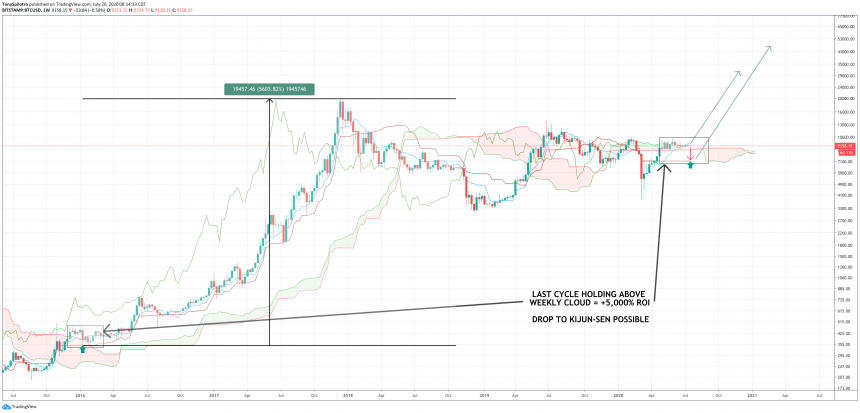
BTCUSD Weekly Ichimoku Zoomed Out | Source: TradingView
If the same thing plays out, crypto traders will have one more chance to buy the dip in Bitcoin price at roughly $7,200 where the Kijun-Sen lies. After that, it could be liftoff into a new bull market.
Related Reading | How Lengthening Bitcoin Cycles Conflict With Halving Driven Supply Theories
According to the last time Bitcoin price held above the Kumo on weekly timeframes, after the drop to the Kijun-Sen, the cryptocurrency rallied over 5,000%.
While this time very well may be different and BTCUSD could plummet here right through the Kijun-Sen, the conditions are similar to the last time Bitcoin went parabolic. And it could happen once again from here.