Over the past few weeks, analysts have said Bitcoin is finally finding a local top.
For the third time in a matter of months, the cryptocurrency was rejected in the $10,000 range. It was a rejection that caused many to reconsider their bullish stance on BTC due to the level’s importance.
Though derivatives data and simple technicals suggest that Bitcoin is far from topping out. The data shows this even after a more than 150% rally from March’s capitulation lows.
Bitcoin Is Unlikely to Top Here, Data Shows
Financial derivatives — such as futures and options — have become increasingly important to crypto over the past few months. The data these markets provide have become increasingly important too.
One top trader shared the chart below. It shows Bitcoin’s macro price action, along with the BitMEX funding rate.
The funding rate is the fee that long positions pay short positions to stabilize market prices. Extremely high or low funding rates indicate that one side of the market might be overleveraged.
The chart indicates that the Bitcoin funding rate is not trending extremely high as it did at every medium-term top over the past two years. This means that should historical precedent hold, BTC has room to rally.
Chart from “Mr. Anderson”
Technical indicators corroborate the sentiment that Bitcoin is not yet at a medium-term top.
As reported by NewsBTC previously, analyst Alex Fiskum explained that market sentiment and the positioning of traders is showing the move from the $3,000s to $10,000 was a “hated rally.”
That’s to say, a majority of investors were on the sidelines or shorting this move because they were skeptical.
The Alice Capital associate shared the chart below to illustrate his point. The chart shows that Bitcoin investors are largely neutral, leaving room for upside once buyers truly step in.
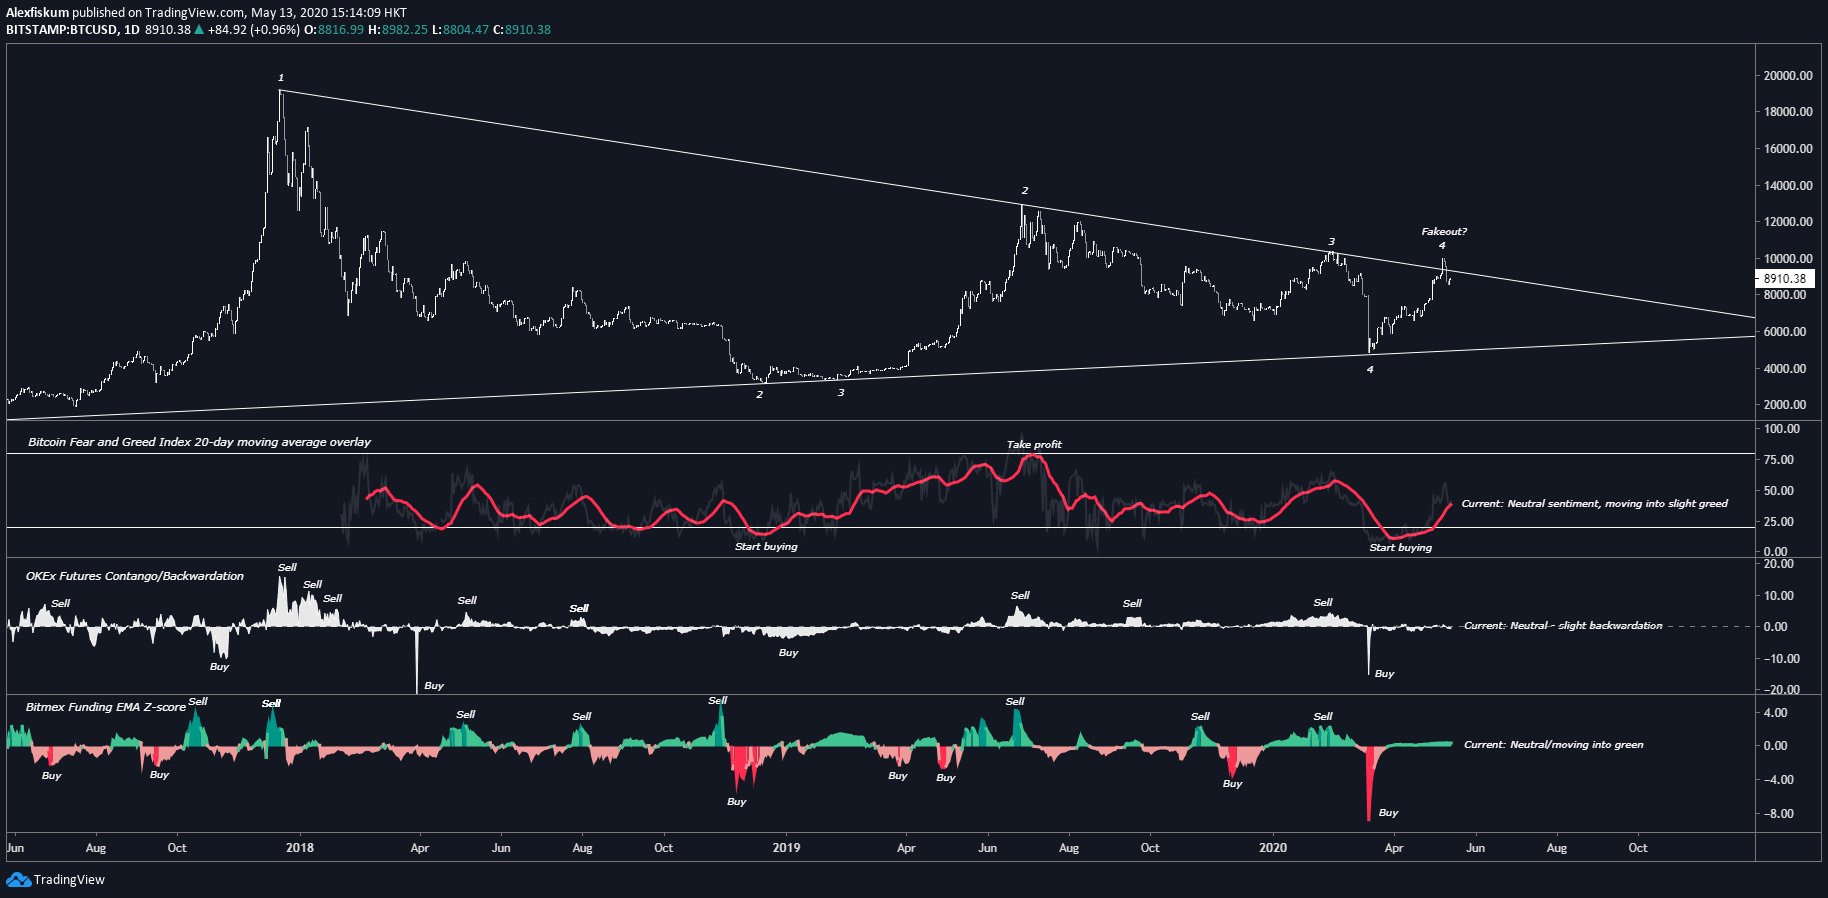
Chart from Alex Fiskum, a cryptocurrency trader at Alice Capital based in Hong Kong.
Kelvin “SpartanBlack” Koh — partner at The Spartan Group — shared this sentiment.
Responding to Fiskum’s chart, he wrote that crypto investors are still showing they are “somewhat risk off.” The options market, the relative strength index, and the “fear and greed” index show this.
Related Reading: Crypto Tidbits: Satoshi Isn’t Dumping His BTC, China ‘Bans’ Cryptocurrency Mining
It Won’t Be Easy
Although the data shows Bitcoin has room to rally, that’s not saying a rally from here will be a breeze.
One trader recently shared the image below. It’s a chart that shows that there is clear Bitfinex order book resistance at $10,000 for Bitcoin.
The chart is notable because it nailed many moves in the BTC price over the past few months, including the March lows and the February highs.
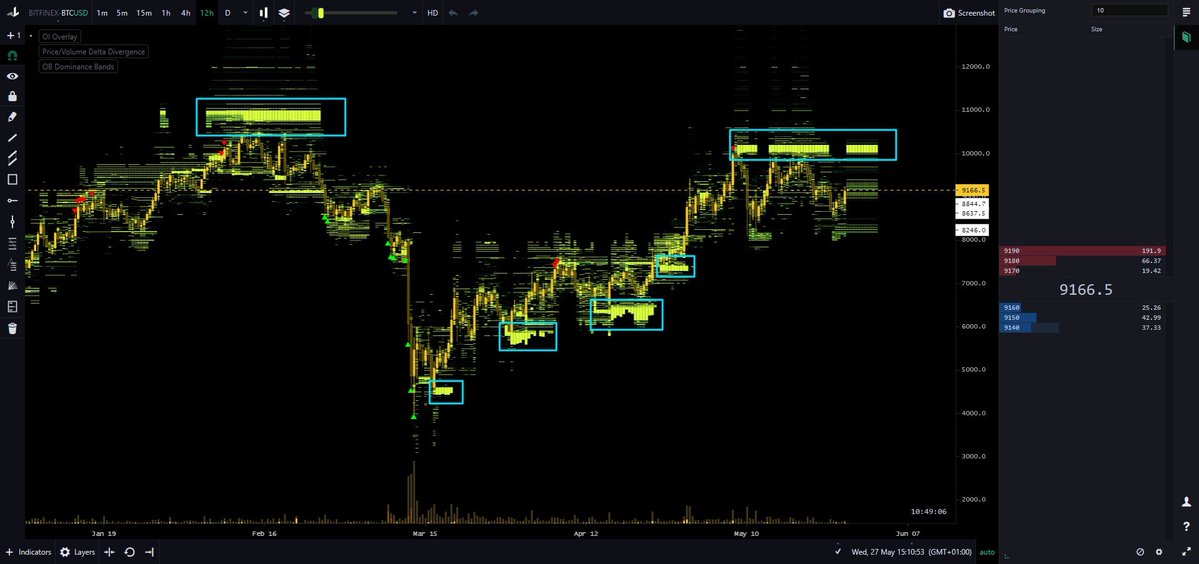
Chart from prominent crypto trader Coiner-Yadox (Yodaskk on Twitter).
Bitcoin is also approaching a key resistance on a medium-term time frame.
As reported by NewsBTC previously, one trader shared that BTC is currently approaching a technical level that has marked local highs four times over the past month.
BTC finding a rejection here, at $9,600, could lead to a retracement back to the high-$8,000s.
Related Reading: The $90 Million Bitcoin Pizza Story Has an Unexpected Silver Lining
Featured Image from Shutterstock