- Ripple Price technically bullish
- Brad Garlinghouse confident of more bank “switch.”
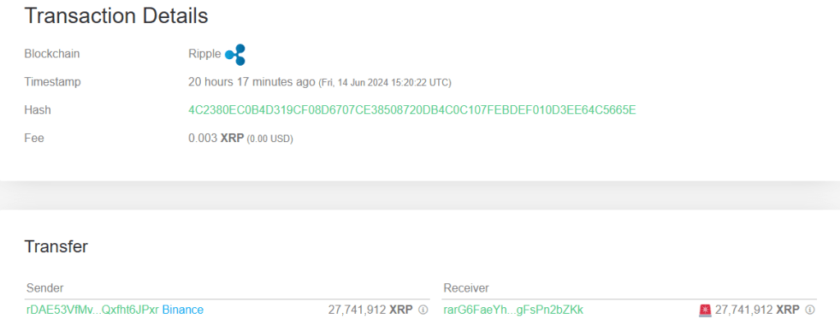
- Transaction volumes low—averaging 26 million as XRP consolidate
The CEO of Ripple the company is satisfied and expecting the total Bank tally to increase by year’s end. So far 200 banks use the network meaning Ripple controls two percent of SWIFT’s market share.
Ripple Price Analysis
Fundamentals
The Ripple community might be over the top, excited about the progress. However, the truth of is, RippleNet—the underlying ledger that holds together xCurrent, xRapid and xVia—pales in comparison with SWIFT—a 40-year global payment network formed by banks. With enthusiasm, Brad Garlinghouse said banks might be ready to “flip the switch” and enjoy a cheap and convenient system, but at 200 versus 10,000—banks using SWIFT, Ripple has managed to clip a mere two percent of SWIFT’s market share.
What’s more, of the 200 banks, 13 companies are using the xRapid system which leverages on XRP as a liquidity tool. Therefore, all things constant, it appears as if there is an XRP undervaluation and if it remains as it is, speculators think Ripple is the next “Amazon.” The only distinction, in this case, it that it will have a fair valuation and a trillion-dollar capitalization.
Candlestick Arrangements
With a market cap of $13,349 million, XRP is the second most valuable coin. Nevertheless, it could lose this position more so if there are rapid ETH price gains in the next 24-36 hours—the network is upgrading. However, since candlestick arrangements favor bulls, our previous XRP/USD trade plan is valid.
Notice that XRP found support mid-range, just above 30 cents meaning bulls have the upper hand. For assurance, we shall trade in line with Sep 2018 gains and that demands patience until after there are substantial gains above 40 cents—a key resistance trend line marking the 61.8 percent Fibonacci retracement level marking Sep 2018 high low. Break above should be accompanied by above average volumes.
After that, both sets of traders should aim at 80 cents and later $1.65. On the flip side, losses below 25 cents invalidate our bullish overview.
Technical Indicators
Thus far, our point of reference is Jan 10 bear bar—83 million versus 30 million. Compared to recent averages of 26 million, it is clear that trading volumes are tapering and for gains above 40 cents, supporting volumes should not only exceed 80 million but equal to or above 123 million or Dec 24 volumes.